ROS Resources: Documentation | Support | Discussion Forum | Index | Service Status | ros @ Robotics Stack Exchange
Ask Your Question
1

How to publish voronoi line as visualization_msgs::Marker topic in Rviz [closed]

asked 2014-11-10 22:10:45 -0500

scopus gravatar image

updated 2014-11-13 08:20:21 -0500

Hi, all. I want to add a ros wrapper for this dynamic_voroni package. I have successfully saved(using iostream) the voronoi lines superposing on maps in a ros node. One of example is here

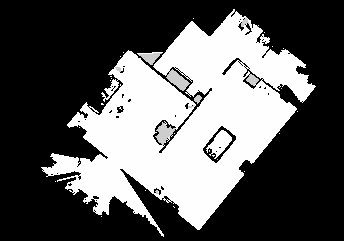
which is same to the results of Lau's codes. However, when I try to publish this voronoi lines as visualization_msgs::Marker in Rviz, althougth messages can be displayed by "rostopic echo" command, nothing is displayed in Rviz. The publish function is showed as follows:

EDIT: The code and the map is updated.

 void Dynamicvoronoi_ros::publishvoronoilines()
{
    visualization_msgs::Marker line_list;
    line_list.header.frame_id = global_frame_;
    line_list.header.stamp = ros::Time();
    line_list.ns =base_frame_;
    line_list.action = visualization_msgs::Marker::ADD;
    line_list.pose.orientation.w = 1.0;
    line_list.type = visualization_msgs::Marker::SPHERE_LIST;
    line_list.scale.x = 0.015;
    line_list.color.g = 1.0;
    line_list.color.a = 1.0;
    line_list.id = 0;
    geometry_msgs::Point p;
    for(int y=ptr_dvoronoi_->getSizeY()-1; y>=0; y--)
    {
        for(int x=0; x<(int)ptr_dvoronoi_->getSizeX(); x++)
        {
            if(ptr_dvoronoi_->isVoronoi(x,y))
            {
                p.x=x;
                p.y=y;
                line_list.points.push_back(p);
                }
         }
    }
    voronoi_line_pub_.publish(line_list);
}

I think this is because of the lack of tf transformation. But I don't know where to add the transformation between map and voronoi lines. Is it enough that the frame_id of header in visualization_msgs::Marker is set to be "map" ?

edit retag flag offensive reopen merge delete

Closed for the following reason the question is answered, right answer was accepted by scopus
close date 2014-11-16 19:12:59.589192

1 Answer

Sort by ยป oldest newest most voted
1

answered 2014-11-11 09:59:01 -0500

dornhege gravatar image

updated 2014-11-13 08:30:48 -0500

You're outputting points, not lines. A line has a start and an end point. Hence the error in rviz. Duplicating a point gives you zero-length lines. This is not the proper fix.

You can either output only the points as points/spheres or retrieve the actual line information from dynamic_voronoi.

Besides that: Yes, you will need to transform the grid coordinates in the dynamic voronoi to map coordinates. The transformation depends on how you fed the information in there in the first place.

Edit: The second problem is that you are completely missing the map to grid conversion. You are using cell indices as point coordinates. This obviously cannot work. How to transform that correctly depends on where/how you store the map cells into your voronoi. You'll need to invert that process.

Here is an example of how we do this for a costmap in a local_planner: https://github.com/GKIFreiburg/gki_na... updateVoronoi and visualizeVoronoi will be of interest, especially you need to replicate how costmap.mapToWorld used.

edit flag offensive delete link more

Comments

Dear Domhege, Thank you very much for your reply. I can't understand your explanation. The voronoiline is stored in a 2D array whose coordinate is (same)superposing on the raw map(as the image above shows. The pixels of raw map are also stored in a 2D array). (to be continue...)

scopus gravatar image scopus  ( 2014-11-12 06:09:50 -0500 )edit

So If the points of the 2D array of voronoi line are output with the position of each point is same to the one on the map, i.e. as the code above shows:

p.x=x; p.y=y;

These points consist of the resulting lines. So why do you say "zero-length line"?

scopus gravatar image scopus  ( 2014-11-12 06:13:20 -0500 )edit

The "lines" that you have in your code are not strictly lines. They are the points that are the points on a line. If you want to draw a line in rviz, you must have a start and end point, which given the screenshot I believe you can extract somehow.

dornhege gravatar image dornhege  ( 2014-11-12 07:02:45 -0500 )edit

If you want to display a set of points, you can simply choose another marker type, e.g. SPHERE_LIST.

dornhege gravatar image dornhege  ( 2014-11-12 07:03:36 -0500 )edit

hi, the map and code are updated. I think since the frame_id of header (global_frame_) is set to be /map (or map), then each points of the voronoi line will be published superposing on the map according their positions( x,y).I also used SPHERE_LIST, but still nothing about voronoi line is displayed

scopus gravatar image scopus  ( 2014-11-13 08:25:08 -0500 )edit

did you try by increasing size

line_list.scale.x = 0.2;
line_list.scale.y = 0.2;
bvbdort gravatar image bvbdort  ( 2014-11-13 08:54:10 -0500 )edit

Question Tools

1 follower

Stats

Asked: 2014-11-10 22:10:45 -0500

Seen: 548 times

Last updated: Nov 13 '14