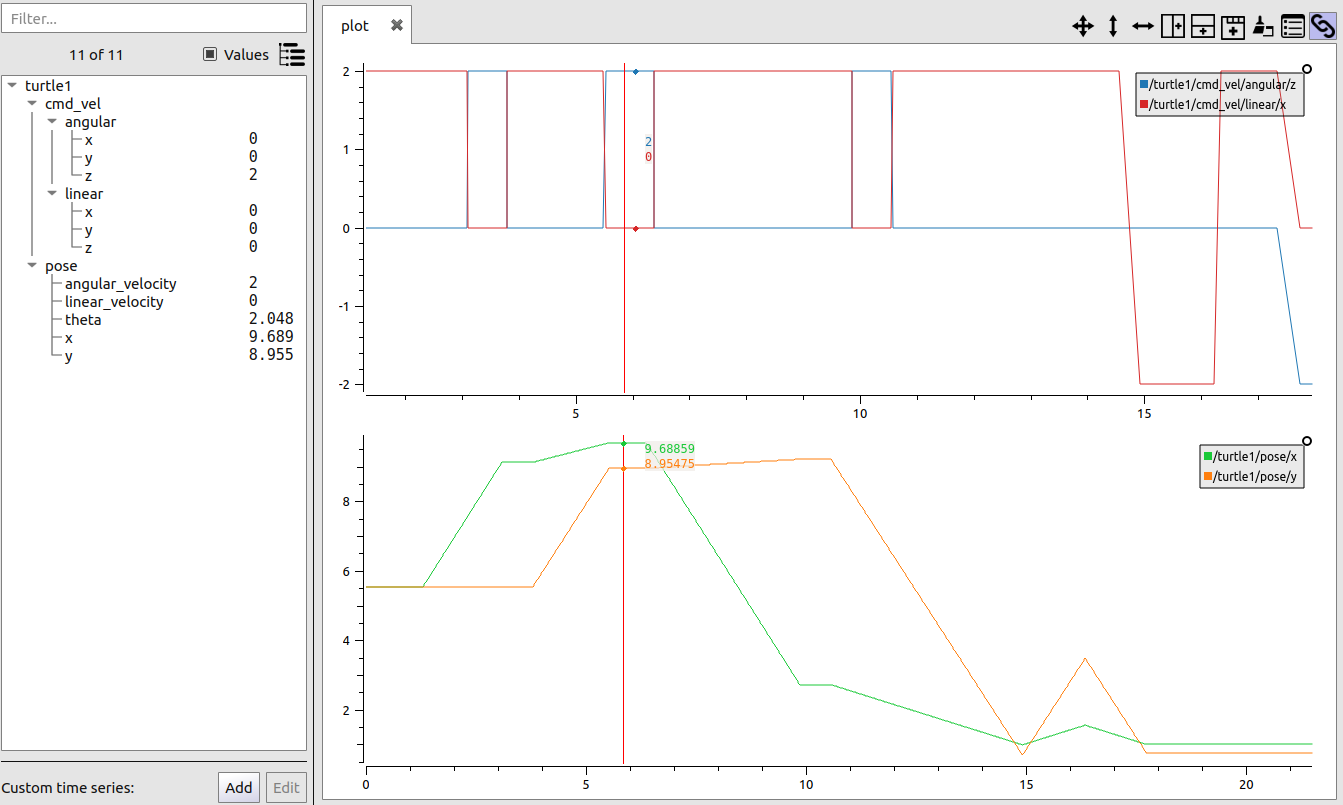
RQT_plot - cmd_vel, odometry, displaying complex messege data.
I want to use rqt_plot for displaying cmd_vel-odometry relation. Whats the easiest way to do so? Is there a function to open all the vectors at once? What are the messeges datafields called, odom/angular.z, odom/twist/angular_z, ....?


