ROS Resources: Documentation | Support | Discussion Forum | Index | Service Status | ros @ Robotics Stack Exchange
Ask Your Question
0

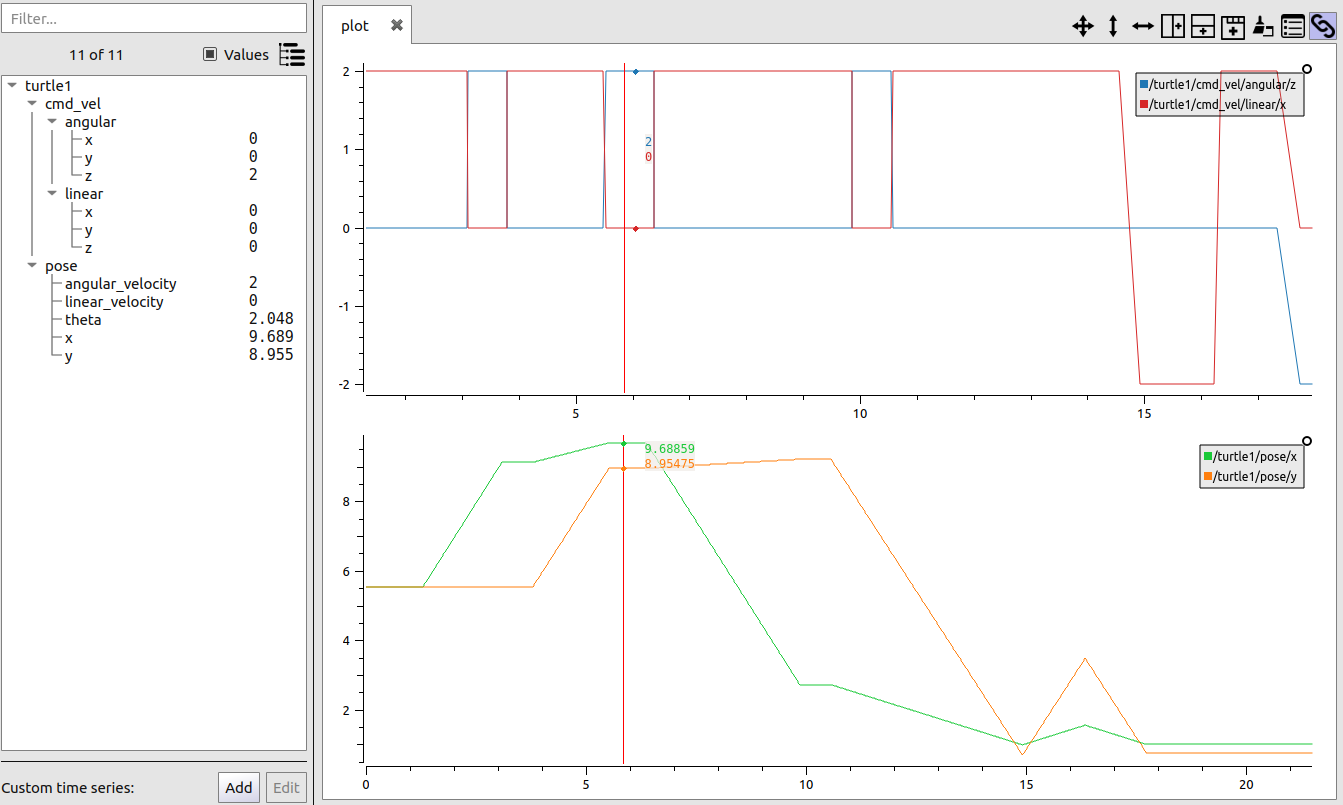
RQT_plot - cmd_vel, odometry, displaying complex messege data.

asked 2020-04-20 03:25:15 -0500

Dragonslayer gravatar image

I want to use rqt_plot for displaying cmd_vel-odometry relation. Whats the easiest way to do so? Is there a function to open all the vectors at once? What are the messeges datafields called, odom/angular.z, odom/twist/angular_z, ....?

edit retag flag offensive close merge delete

1 Answer

Sort by » oldest newest most voted
1

answered 2020-05-04 09:44:08 -0500

Davide Faconti gravatar image

You might want to consider using PlotJuggler instead. It will make much easier to display and compare data, like this.

image description

edit flag offensive delete link more

Comments

Thanks, that looks like what I was looking for.

Dragonslayer gravatar image Dragonslayer  ( 2020-05-04 10:13:37 -0500 )edit

Question Tools

1 follower

Stats

Asked: 2020-04-20 03:25:15 -0500

Seen: 593 times

Last updated: May 04 '20