[RVIZ] MarkerArray Display
Hi. I am using: RVIZ 1.13.1 melodic ubuntu 18.04
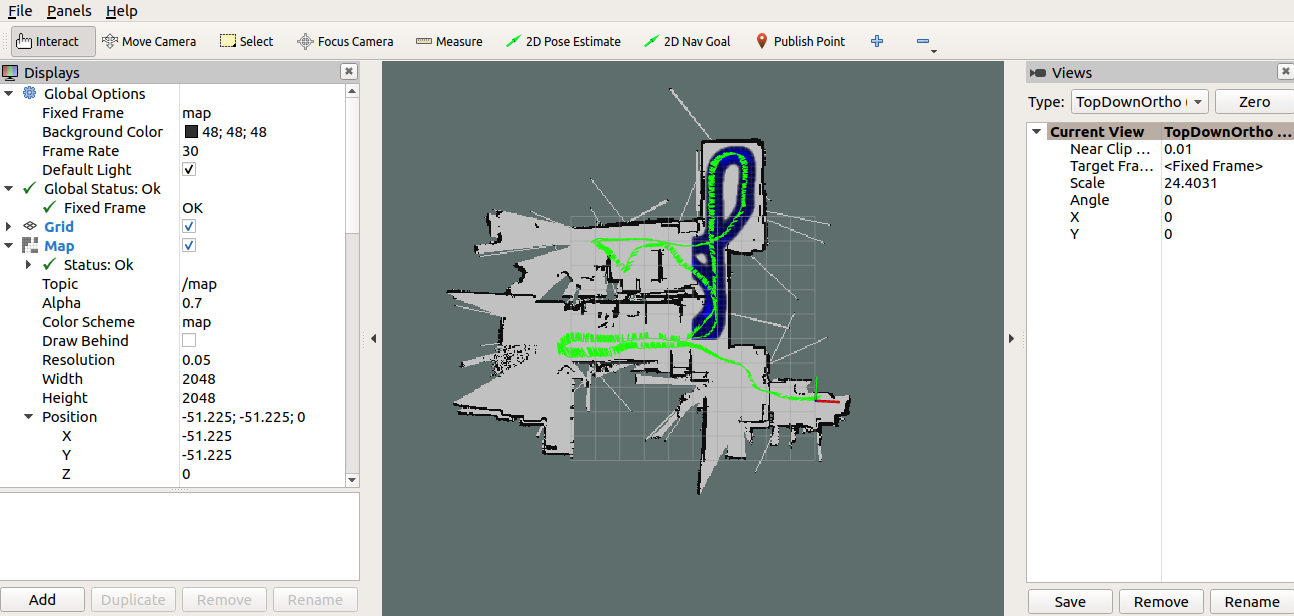
I have a task to visualize sensor data on a map. In the image below, it can be saw that the blue MarkerArray able to display correctly according to the path that the robot has moved. However, suddenly the MarkerArray failed to display on the left hand side and bottom right of the map. It seems like it is unable to publish anything if the coordinate provided is a negative value.

Can anyone suggest me what should i do to solve this issue ?
Below is my coding in python to generate marker array.
        triplePoints = []
        colorsGroup = []
        markerArray = MarkerArray()
        for (x,y,z,a) in gdm_mean_data:
            if not numpy.isnan(a) and a > 0.10000000149 :
                p = Point()
                p.x = x
                p.y = y
                p.z = -5
                marker = Marker()
                marker.header.frame_id = "/map"
                marker.type = marker.POINTS
                marker.action = marker.ADD
                marker.scale.x = 0.1
                marker.scale.y = 0.1
                marker.scale.z = 0.1
                colorsGroup.append(ColorRGBA(0,0,a,a))
                marker.pose.orientation.w = 1
                t = rospy.Duration()
                marker.lifetime = t
                triplePoints.append(p)
        marker.points = triplePoints
        marker.colors = colorsGroup
        markerArray.markers.append(marker)
        mean_marker.publish(markerArray)


and is there anyway to change the map position (bottom left) to start with (0,0) ?
I would test few things :
gdm_mean_datarostopic echo /YOUR_MARKER_TOPICif those values are published (if yes then there is something wrong with the marker)Thanks @Delb! After review my own coding, it seems like it is my own algorithm problem xD Thanks for the hints !
Can you answer your own question detailling what you did to make things work and mark it as correct please ? It can help future readers encoutering similar issues.