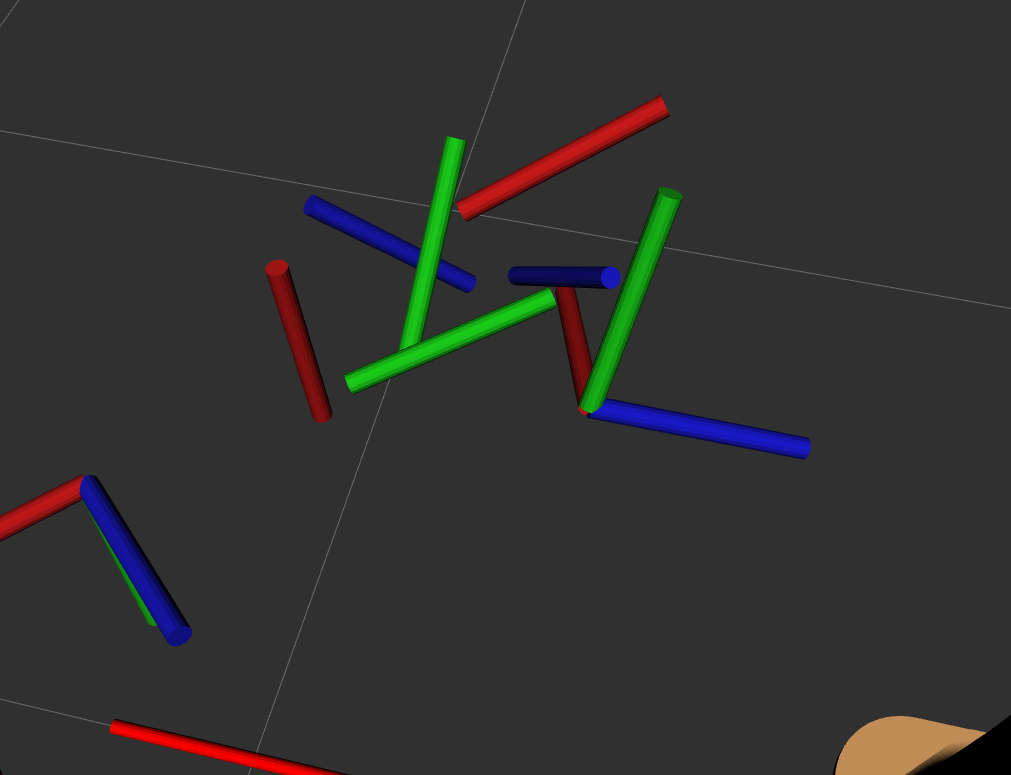
Axis displayed improperly on rviz_visual_tools
Good day,
I am having an issue with the display of some axis markers on rviz_visual tools.
As you can see in the image some of them look broken up (x y and z-axis do not intersect each other at any point and they seem randomly placed).

I am not quite sure what is my mistake, the Affine3d matrices representing the homogenous transformations are being built by 3 Eigenvectors result of PCA and a translation vector that comes from data within my code.
As a matter of fact, this is a matrix that displays properly as an axis
 0.38385 -0.487015  0.784522  0.786108
 0.898659  0.392362 -0.196125  0.101786
-0.212301    0.7803  0.588268   1.20033
        0         0         0         1
And this one is one that causes the visualization issue shown above.
 0.437251 -0.692034  0.574369  0.749188
 0.824417 0.0532262 -0.563475 0.0604565
-0.359372 -0.719899 -0.593798   1.21353
        0         0         0         1
Both matrices have valid rotation and translation values, i.e. all rotation column vectors are unitary in both matrices


