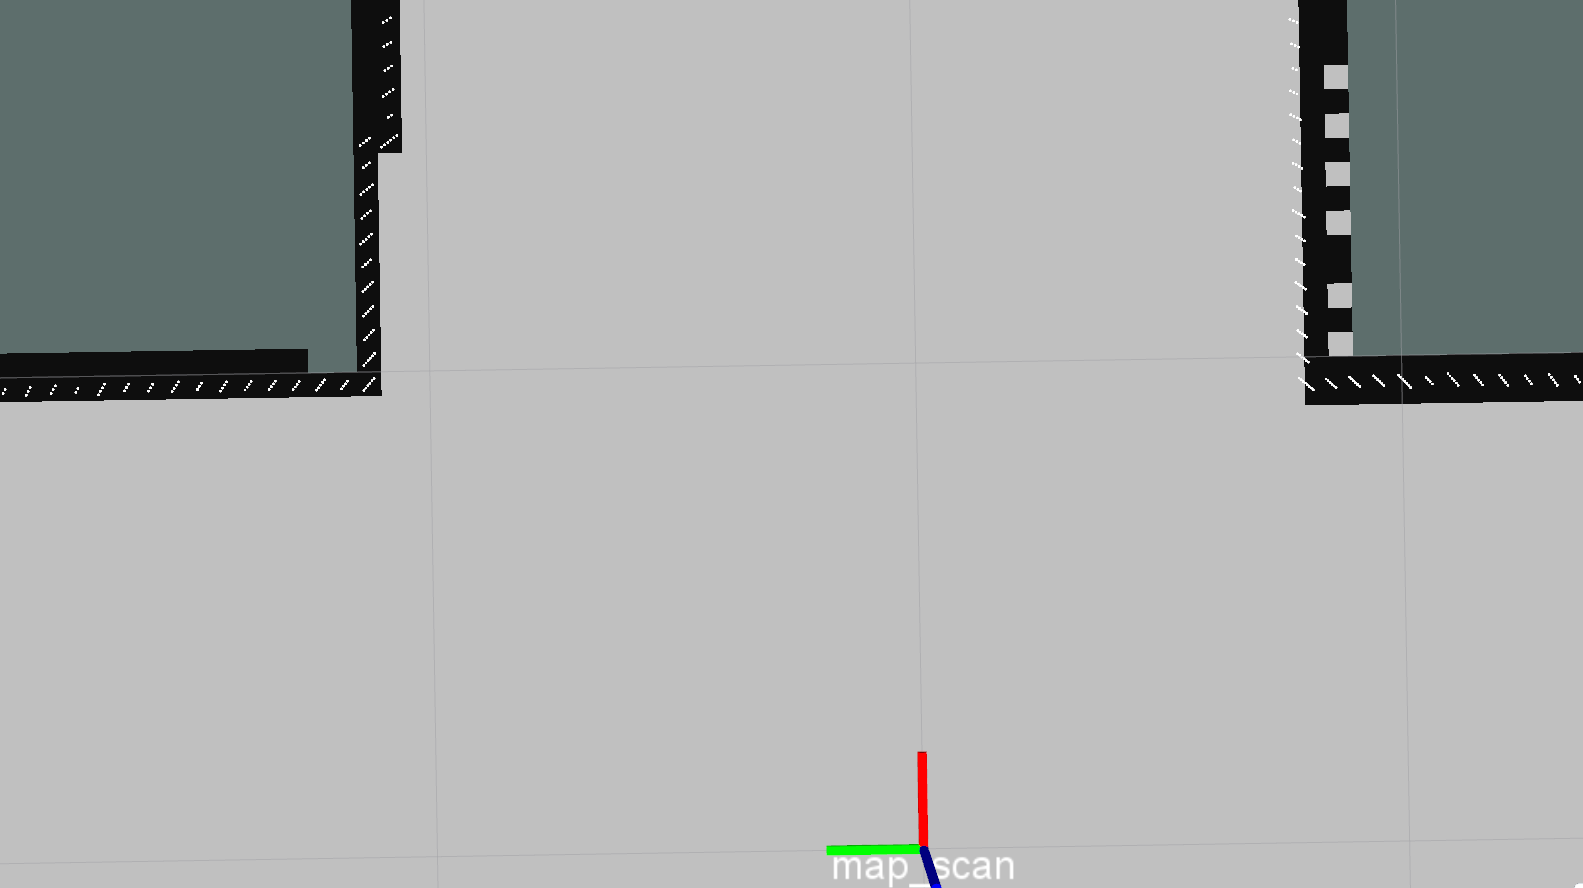
If you look carefully, you will see that the raytraced points are forming line segments that are oriented perpendicular to rays from the origin. Each line segment is also centred on a cell in the grid map. I haven't used the package you mentioned, but this suggests to me that quantization due to the cell size on the grid map is causing the effect you are seeing.
I had a look at the code for the ray tracer. It is calculating the distance for each ray from the sensor's pose as the distance from the sensor pose to the centre of the nearest grid cell. I haven't had time to try it out myself because it's not just a node that I can plug data into, but I bet that if you changed your grid size to be really large, you would see a nice arc within each cell. This is why you get the pattern you are seeing. It is not tracing around the edge of each cell: that would be much more computationally expensive, involving intersecting rays and polygons.
If you need to have better data from the raytracer, you will need to resample your grid map with a smaller cell size. Other than that, you could reduce the number of points in your range scan to reduce the number of little lines, although you will miss data at longer distances, or you could filter the laser data to match lines (longer than a few cells).


