
Fitting line to pointcloud data
Hello Everyone, I am trying to fit a line to a point-cloud data received from a 2D lidar.
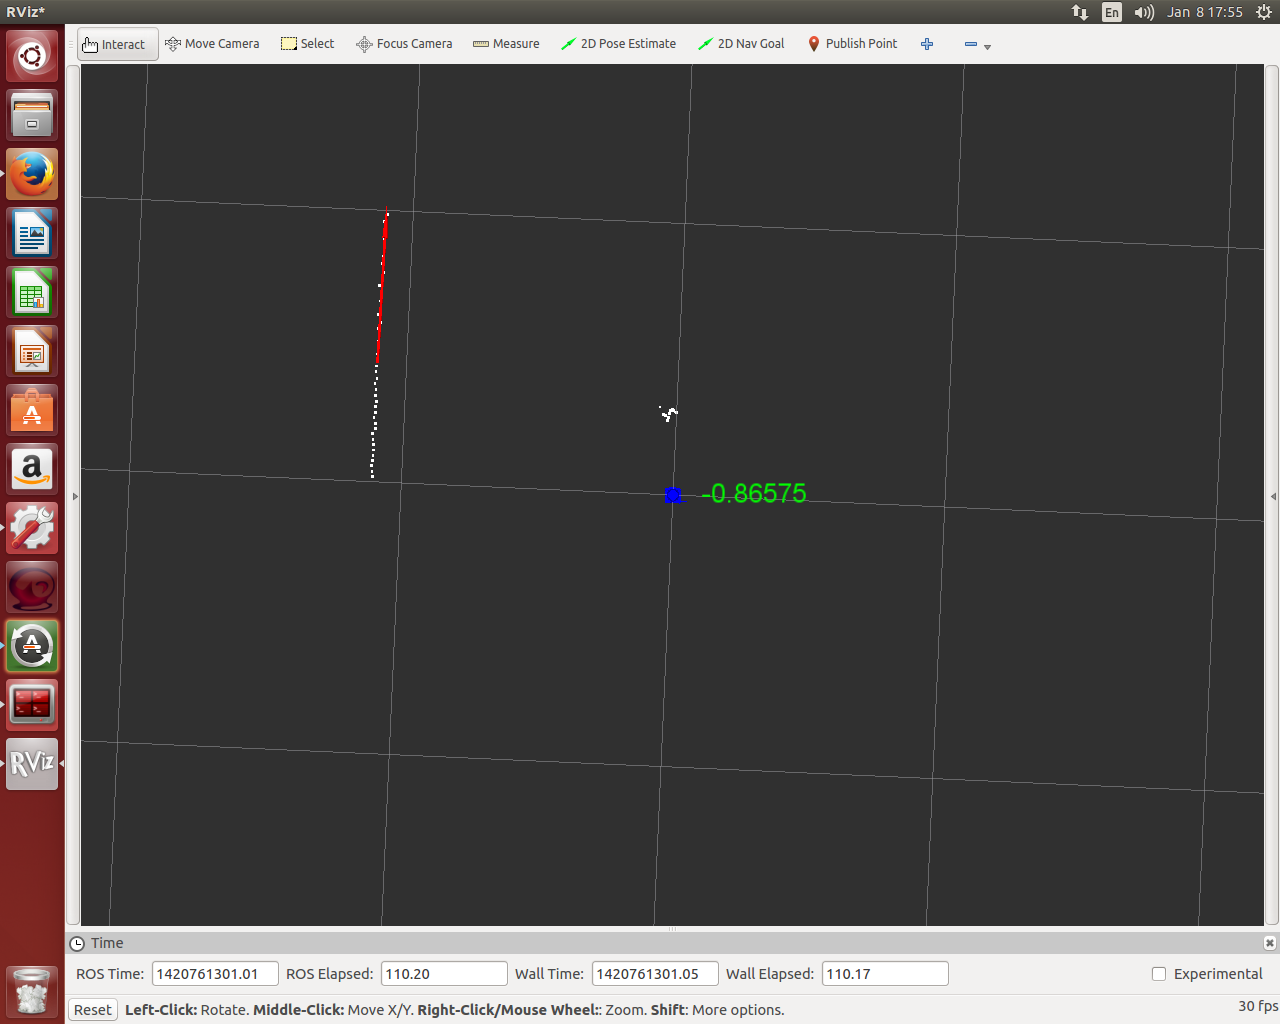
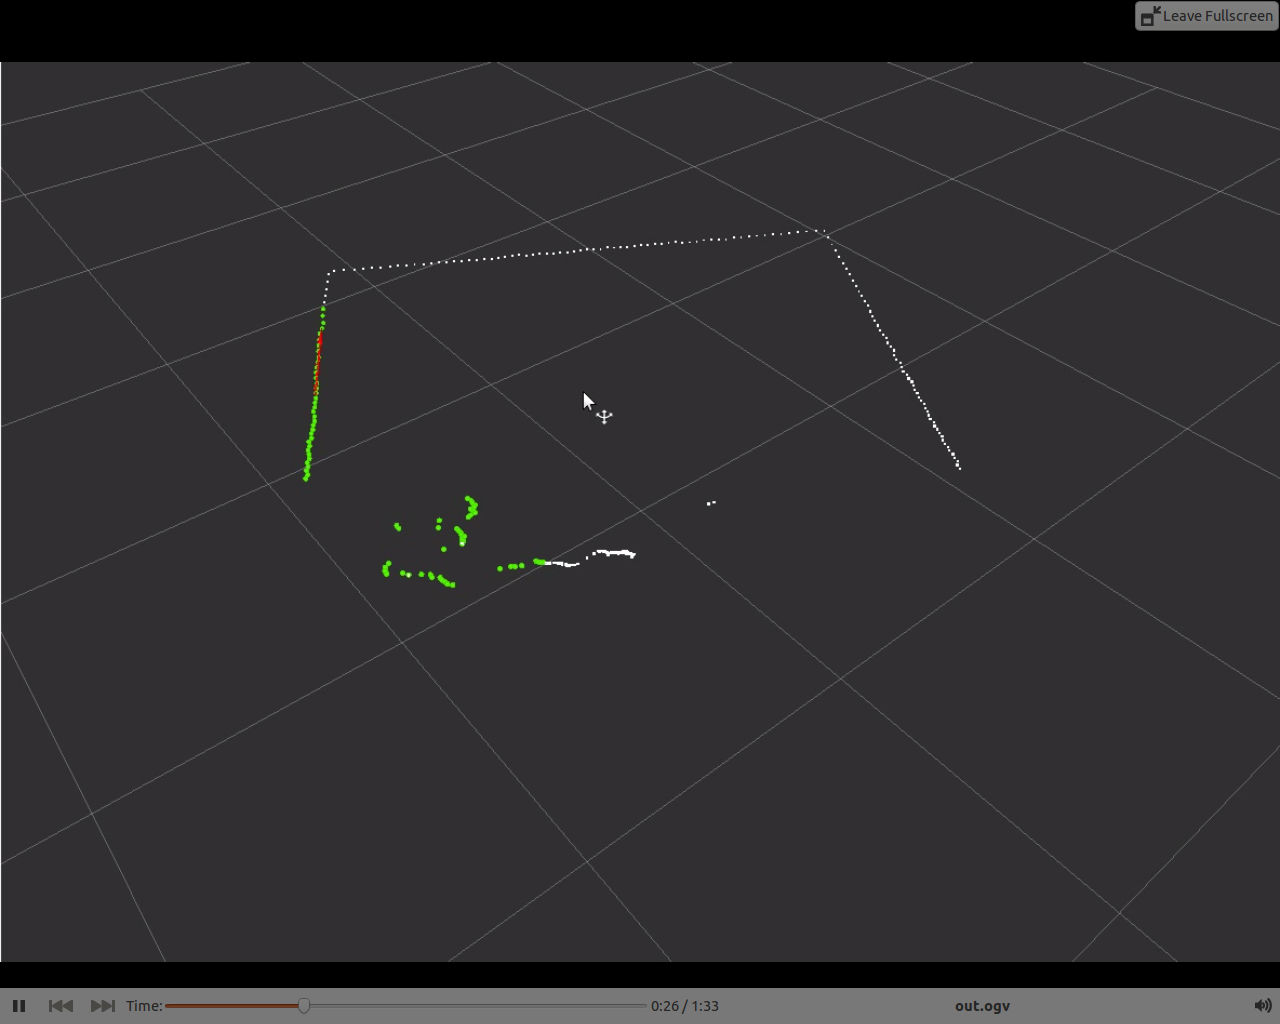
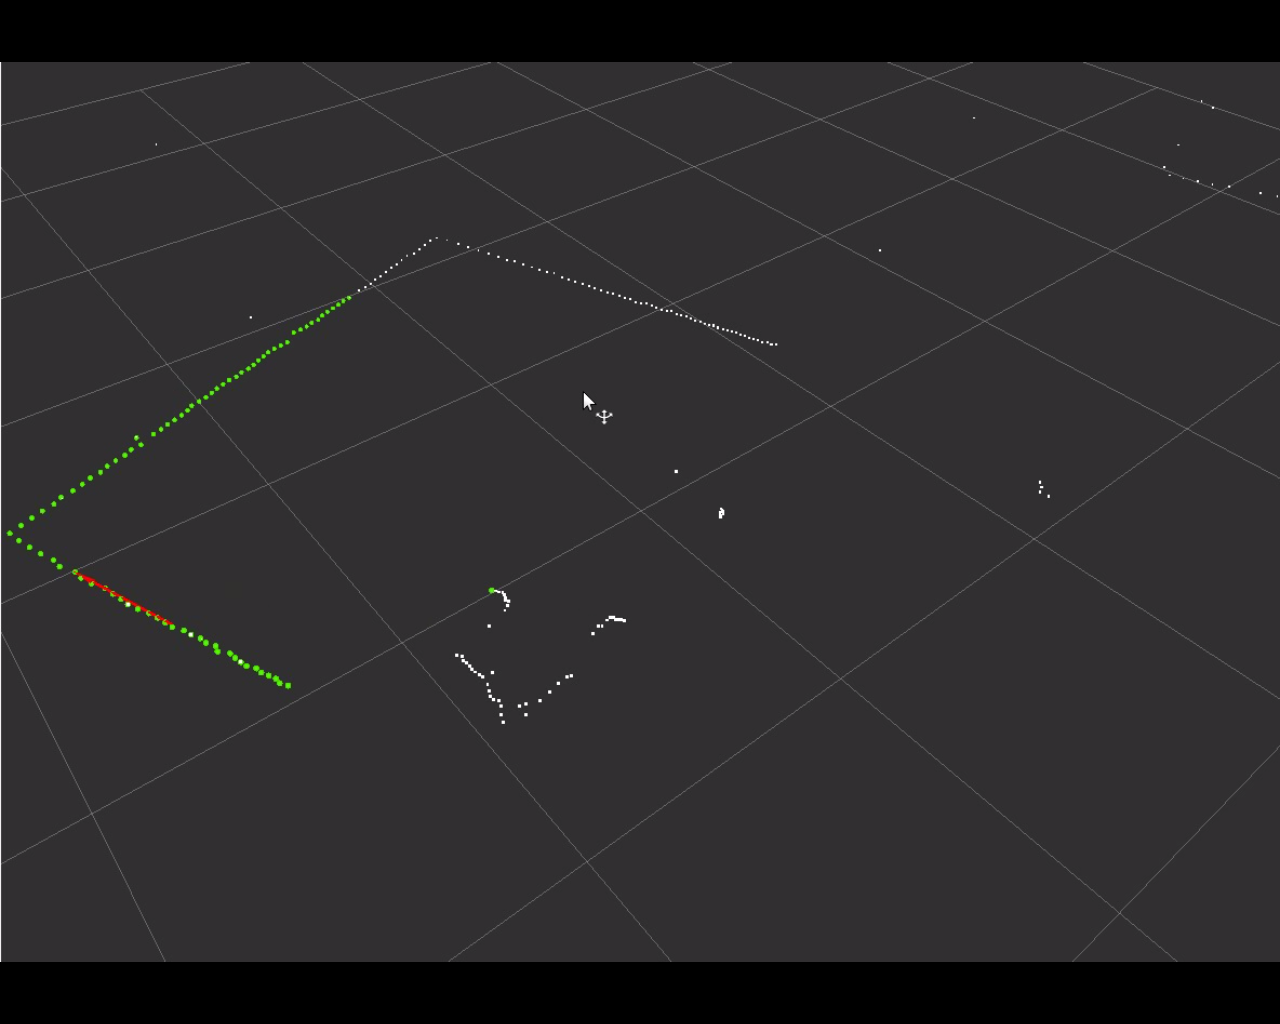
I am using random sample consus from pcl library to get this done. The first picture when the LIDAR is aligned with the wall, the line fits well. But when lidar is yawed the line deviates by certain degrees.

Here is the code which does it:
 ros::Publisher marker_pub;
ros::Publisher pub;
ros::Publisher pub1;
visualization_msgs::Marker marker;
visualization_msgs::Marker text_1;
#define PI 3.14159265
using namespace std;
float angle=0.0;
std::ostringstream tostr;
#include <sstream>
void cloud_cb (const pcl::PCLPointCloud2ConstPtr& input)
{
        pcl::PCLPointCloud2::Ptr cloud_filtered (new pcl::PCLPointCloud2);
    pcl::PassThrough<pcl::PCLPointCloud2> pass_through_x;
        pcl::PassThrough<pcl::PCLPointCloud2> pass_through_y;

        pass_through_x.setInputCloud(input);
    // set fieldname we want to filter over
    pass_through_x.setFilterFieldName ("x");
    // set range for selected field to 1.0 - 1.5 meters
    pass_through_x.setFilterLimits (0.0,1.0);
    // do filtering
    pass_through_x.filter (*cloud_filtered);

    pass_through_y.setInputCloud (cloud_filtered);
    // set fieldname we want to filter over
    pass_through_y.setFilterFieldName ("y");
    // set range for selected field to 1.0 - 1.5 meters
    pass_through_y.setFilterLimits (0.0, 2.0);
    // do filtering
    pass_through_y.filter (*cloud_filtered);

        pub.publish(*cloud_filtered);
    pcl::PointCloud< pcl::PointXYZ> cloud;
        pcl::fromPCLPointCloud2(*cloud_filtered, cloud);
        pcl::ModelCoefficients::Ptr coefficients (new pcl::ModelCoefficients);
    pcl::PointIndices::Ptr inliers (new pcl::PointIndices);
    // Create the segmentation object
    pcl::SACSegmentation<pcl::PointXYZ> seg;
    // Optional
    seg.setOptimizeCoefficients (true);
    // Mandatory
    seg.setModelType (pcl::SACMODEL_LINE);
    seg.setMethodType (pcl::SAC_RANSAC);
    seg.setDistanceThreshold (0.006);
    seg.setInputCloud (cloud.makeShared ());
    seg.segment (*inliers, *coefficients);

    if (inliers->indices.size () == 0)
    {
    PCL_ERROR ("Could not estimate a LINE model for the given dataset.");
    }
        angle=2*asin(coefficients->values[4])*180.0/PI;//formulae for quarternions.
    //std::cerr <<"deviation from the wall:"<<angle<<endl;

    tostr << angle;
    text_1.ns = "vehicle_orientation";
    text_1.header.frame_id = "laser";
    text_1.header.stamp = ros::Time::now();
    text_1.type = visualization_msgs::Marker::TEXT_VIEW_FACING;
        text_1.action = visualization_msgs::Marker::ADD;
        text_1.pose.position.x =0.0;// coefficients->values[0];
        text_1.pose.position.y =-0.3;// coefficients->values[1];
        text_1.pose.position.z =0.0;// coefficients->values[2];
        text_1.pose.orientation.x = 0.0;
        text_1.pose.orientation.y = 0.0;
        text_1.pose.orientation.z = 0.0;
        text_1.pose.orientation.w = 1.0;
        text_1.id = 1;
        text_1.text=tostr.str();
        tostr.str("");

        text_1.scale.z = 0.12;
        text_1.color.r = 0.0f;
        text_1.color.g = 1.0f;
        text_1.color.b = 0.0f;
        text_1.color.a = 1.0f;
        text_1.lifetime = ros::Duration();
            marker_pub.publish(text_1);

              marker.ns = "vehicle_orientation";
             marker.header.frame_id = "laser";
             marker.header.stamp = ros::Time::now();
             marker.type = visualization_msgs::Marker::ARROW;
            marker.action = visualization_msgs::Marker::ADD;
        marker.pose.position.x = coefficients->values[0];
        marker.pose.position.y = coefficients->values[1];
        marker.pose.position.z = coefficients->values[2];
        marker.pose.orientation.x = coefficients->values[3];
        marker.pose.orientation.y = coefficients->values[4];
        marker.pose.orientation.z = coefficients->values[5];
        marker.pose.orientation.w = 0.0;
        marker.id = 0;
        marker.scale.x = 0.6;
        marker.scale.y = 0.01;
        marker.scale.z = 0.01;
// Set the color -- be sure to set alpha to something ...add a comment
