
Create a plot with x and y coordinates
Hi guys, I have a robot whose data I can write to the website, but I should do a plot. I try to use it, but it doesn't work very well.
https://stackblitz.com/edit/canvasjs-...
My code snippet: 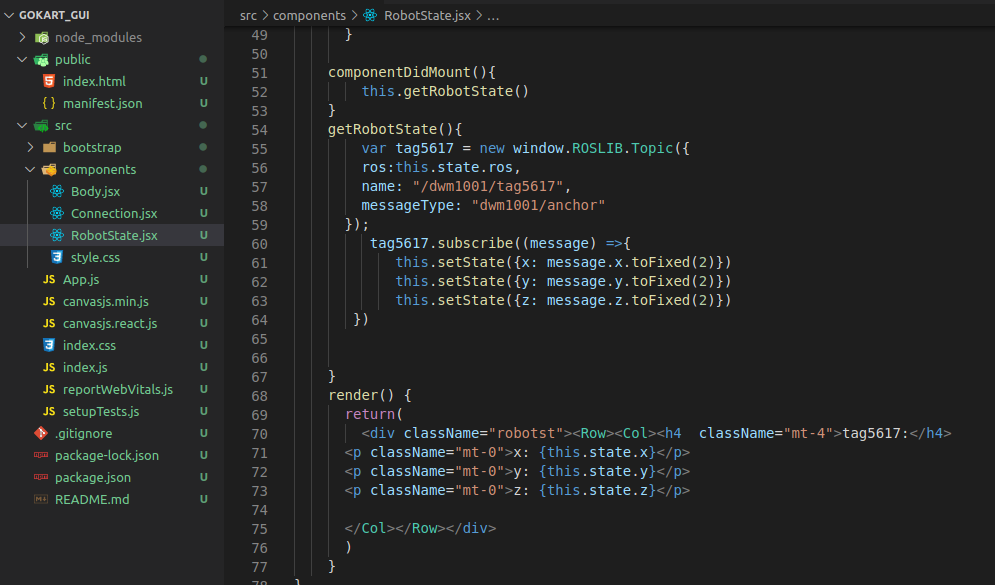
Can anyone help?

I think your question needs a bit more context. If you are receiving the data from your robot (including x and y) then it seems more a question that needs to be directed to whatever library you are using for plotting. It seems you use javascript with predefined points. Now you should get the position from the topic of your robot and replace it there. I don't know how to do it with javascript.