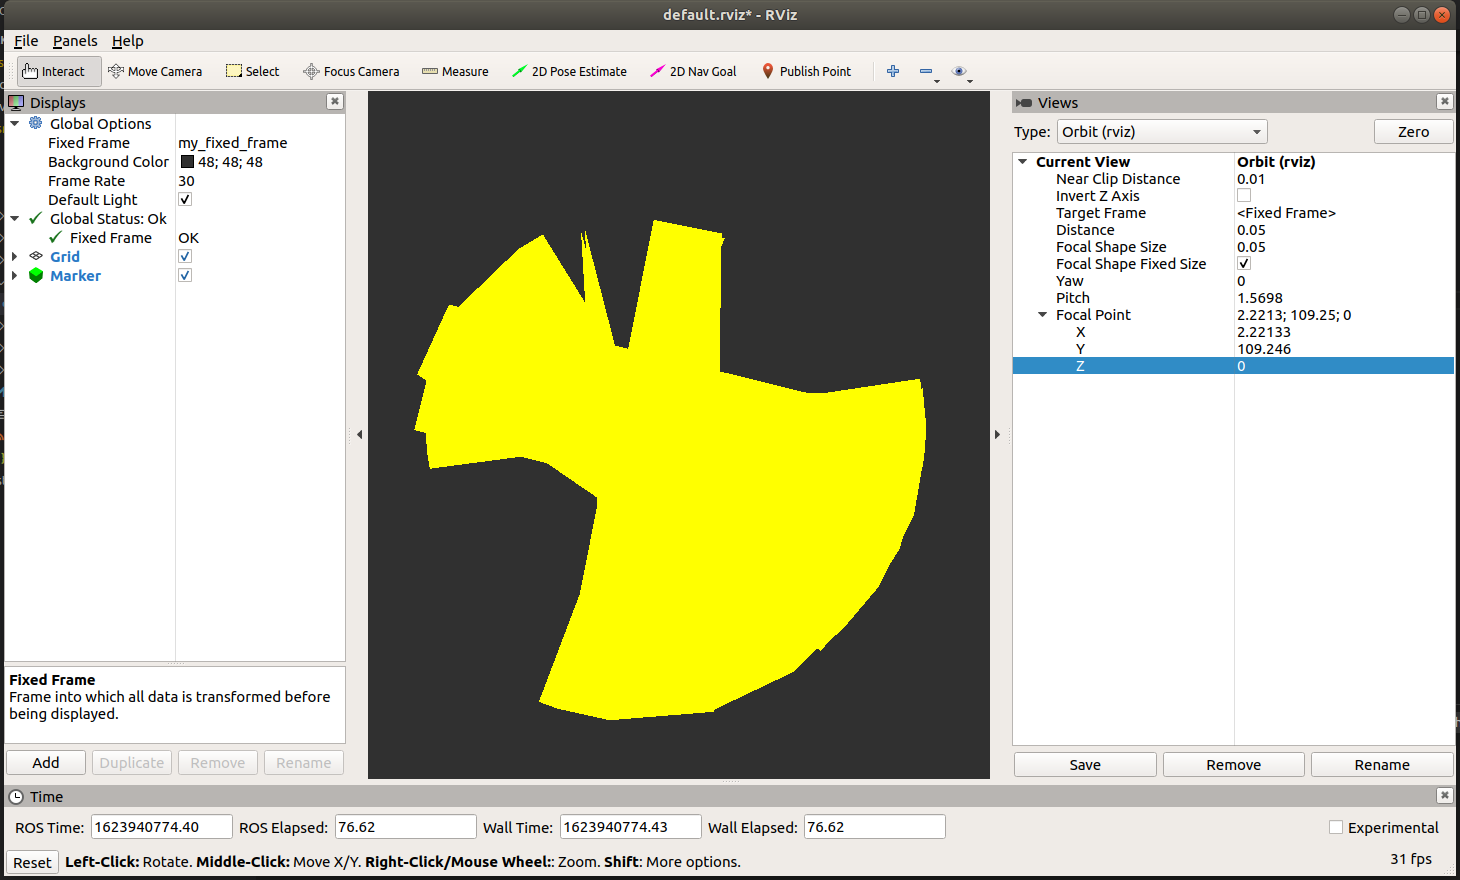
Visualize global coordinate points as Markers in Rviz
Hello all,
I got a .csv file containing latitude and longitude coordinates of over 100 points. The goal is to form a LINE_STRIP from these points. Here's my code. Here's my .csv file. The general idea of the code is to append all points to a marker object of LINE_STRIP type, and publish the object in the while loop.
But it does not show anything, although using the same code idea, I can visualize simple points (x and y values of line_point are of 0.0, 1.0, 2.0 , ...).
I tried taking 2 points in the .csv file, form a LINE_STRIP marker, and publish it. But it still showed nothing.
I then tried setting the x of the first point down to 1.xxxxxxxx, and keep y of the first point, x, y of the second point the same (x ~ 12.xxxxxxxx; y ~ 109.xxxxxx). And this successfully showed.
I guess there's something wrong with the current "setting", when I can't visualize global coordinates this way.
Please give some advice.


