
The site is read-only. Please transition to use Robotics Stack Exchange
| ROS Resources: Documentation | Support | Discussion Forum | Index | Service Status | ros @ Robotics Stack Exchange |
| | 1 | initial version |
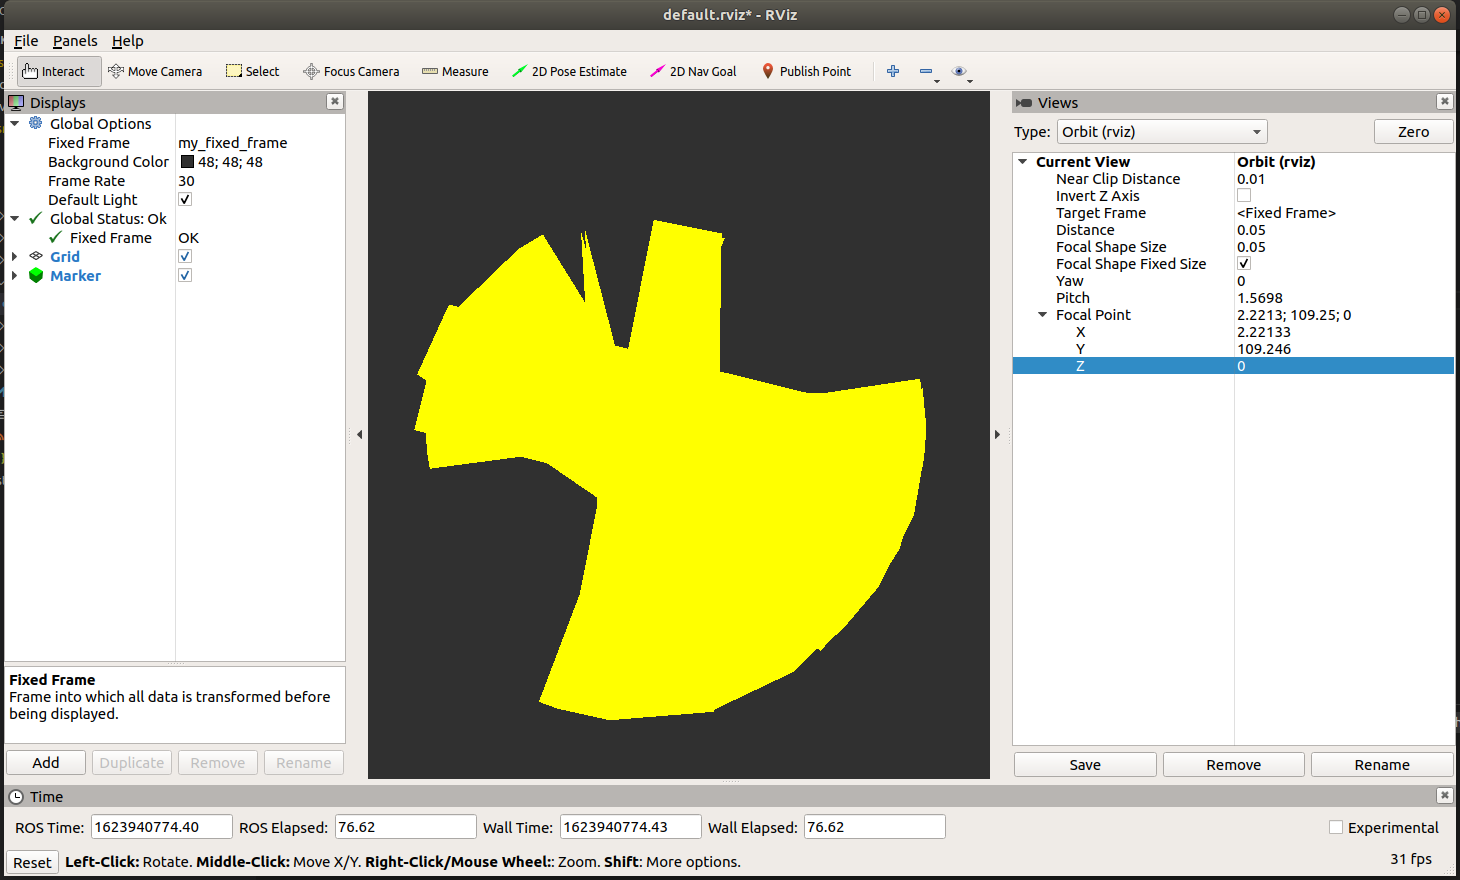
What are you using to visualize the points? If it is RVIZ, then you need your coordinates to be in a cartesian coordinate system. Right now it is interpreting all your lat/lon points as as x/y in meters. This means it is interpreting that all your points are within a centimeter of each other.
If you set RVIZ with the following settings, you will see that it is there, just all in a very small space:
You need to convert from lat/lon to a cartesian coordinate system (such as UTM).
Here is one such way to do that:
Read the first point in and convert to utm. This will be the 0,0 point of my_fixed_frame. Convert all your points to utm while adding them to marker.points and subtract off the utm coordinates of the first point. This shifts the global utm coordinate of the point to a local coordinate. Publish the utm to my_fixed_frame transform. Publish the markers.
Sample code for that method:
#!/usr/bin/env python

from visualization_msgs.msg import Marker
from geometry_msgs.msg import Point
import rospy
import pandas as pd
import utm
import tf

count = 0
MARKERS_MAX = 100
csv_file = "/path/to/NT-all-points.csv"

rospy.init_node('lane_line_GT_node', anonymous=True)
pub = rospy.Publisher('lane_line_GT', Marker, queue_size=10)
df = pd.read_csv(csv_file)

tf_bcast = tf.TransformBroadcaster()

marker = Marker()
marker.header.frame_id = "my_fixed_frame"
marker.type = marker.LINE_STRIP
marker.action = marker.ADD

# marker scale
marker.scale.x = 0.03
marker.scale.y = 0.03
marker.scale.z = 0.03

# marker color
marker.color.a = 1.0
marker.color.r = 1.0
marker.color.g = 1.0
marker.color.b = 0.0

# marker orientaiton
marker.pose.orientation.x = 0.0
marker.pose.orientation.y = 0.0
marker.pose.orientation.z = 0.0
marker.pose.orientation.w = 1.0

# marker position
marker.pose.position.x = 0.0
marker.pose.position.y = 0.0
marker.pose.position.z = 0.0

# marker line points
marker.points = []

# The first lat/lon will be our 0,0 point. Convert to utm
utm_start = utm.from_latlon(df.at[0, 'latitude'], df.at[0, 'longitude'])

for i in range(0, 127, 3):
    line_point = Point()

    # Get the UTM point of the lat/lon at index i
    utm_ne = utm.from_latlon(df.at[i, 'latitude'], df.at[i, 'longitude'])

    # Get the x,y of the i'th point relative to the start point
    line_point.x = utm_ne[0] - utm_start[0]
    line_point.y = utm_ne[1] - utm_start[1]
    line_point.z = 0

    print(f"[debug]: latitude: {line_point.x}; type: {type(line_point.x)}")
    print(f"[debug]: longitude: {line_point.y}; type: {type(line_point.y)}")

    marker.points.append(line_point)

while not rospy.is_shutdown():
    print('[debug] running ... ')

    # Continually publish the utm->my_fixed_frame transform
    tf_bcast.sendTransform(
        (utm_start[0],utm_start[1],0),
        (0,0,0,1),
        rospy.Time.now(),
        "my_fixed_frame", # child
        "utm")  # parent

    # Publish the Marker
    pub.publish(marker)

    rospy.sleep(0.5)
Hope this helps!
 ROS Answers is licensed under Creative Commons Attribution 3.0 Content on this site is licensed under a Creative Commons Attribution Share Alike 3.0 license.