As @Choco93 said, you could add the following to your urdf file:
<gazebo>
    <plugin name="p3d_base_controller" filename="libgazebo_ros_p3d.so">
      <alwaysOn>true</alwaysOn>
      <updateRate>50.0</updateRate>
      <bodyName>base_footprint</bodyName>
      <topicName>ground_truth/state</topicName>
      <gaussianNoise>0.01</gaussianNoise>
      <frameName>world</frameName>
      <xyzOffsets>0 0 0</xyzOffsets>
      <rpyOffsets>0 0 0</rpyOffsets>
    </plugin>
</gazebo>
To feed ground truth to rtabmap, we need to convert the /ground_truth/state topic to TF, and change the base_footprint frame to a fake one like base_footprint_gt. This can be done with odom_msg_to_tf node:
$ rosrun rtabmap_ros odom_msg_to_tf odom:=ground_truth/state _frame_id:=base_footprint_gt
$ rosrun tf static_transform_publisher 0 0 0 0 0 0 world map 100
The TF world -> base_footprint_gt will be published. I added world -> map static transform just for convenience, to be able to see both base_footprint and base_footprint_gt in RVIZ under world global frame. Last thing to do is to setup ground truth parameters of rtabmap node:
<node pkg="rtabmap_ros" type="rtabmap" name="rtabmap" args="-d">
  ...
  <param name="ground_truth_frame_id" value="world"/>
  <param name="ground_truth_base_frame_id" value="base_footprint_gt"/>
</node>
With rtabmapviz, you will see the ground truth path in gray, and the estimated path in blue. In View->Statistics->GT panel, you will see ATE (absolute trajectory error) statistics.
EDIT
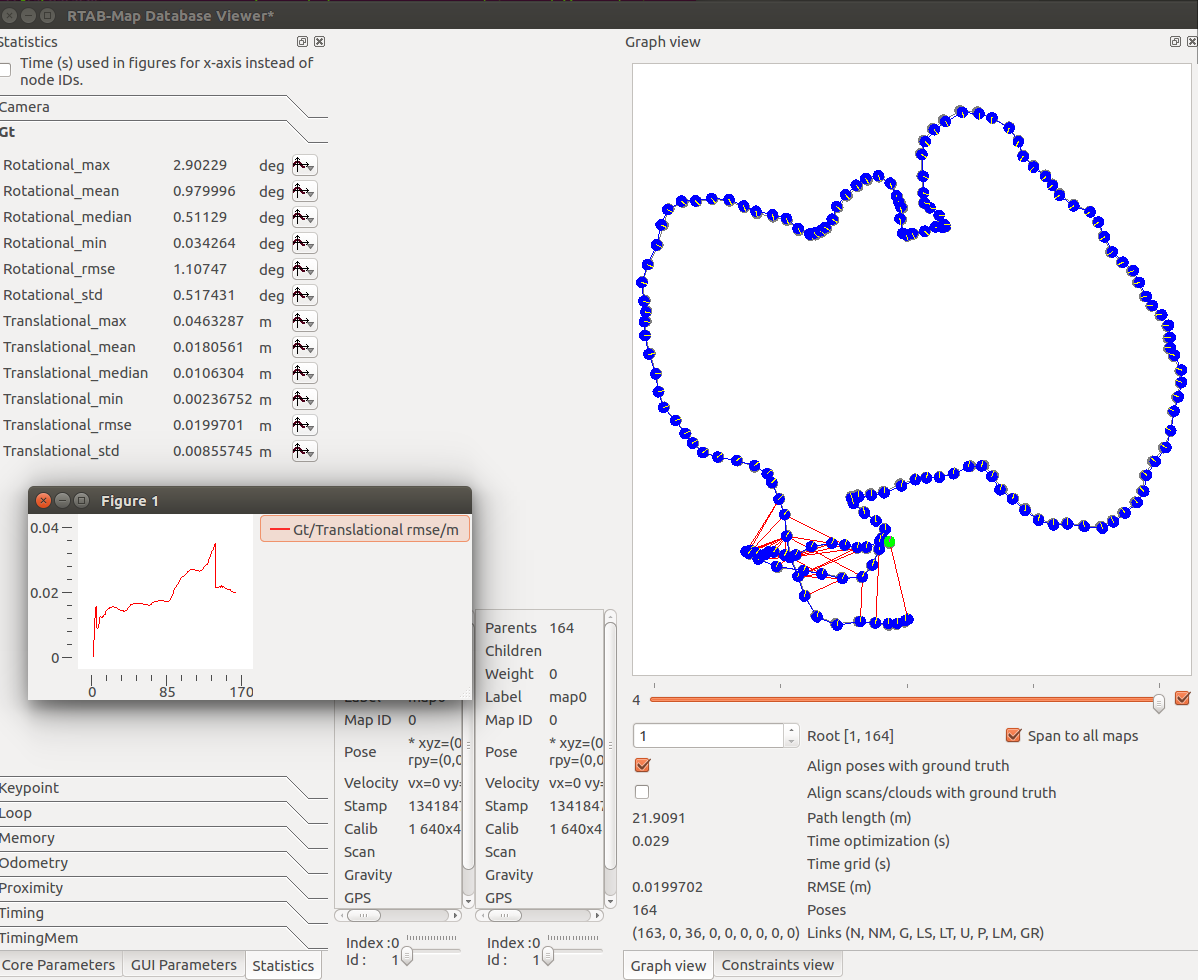
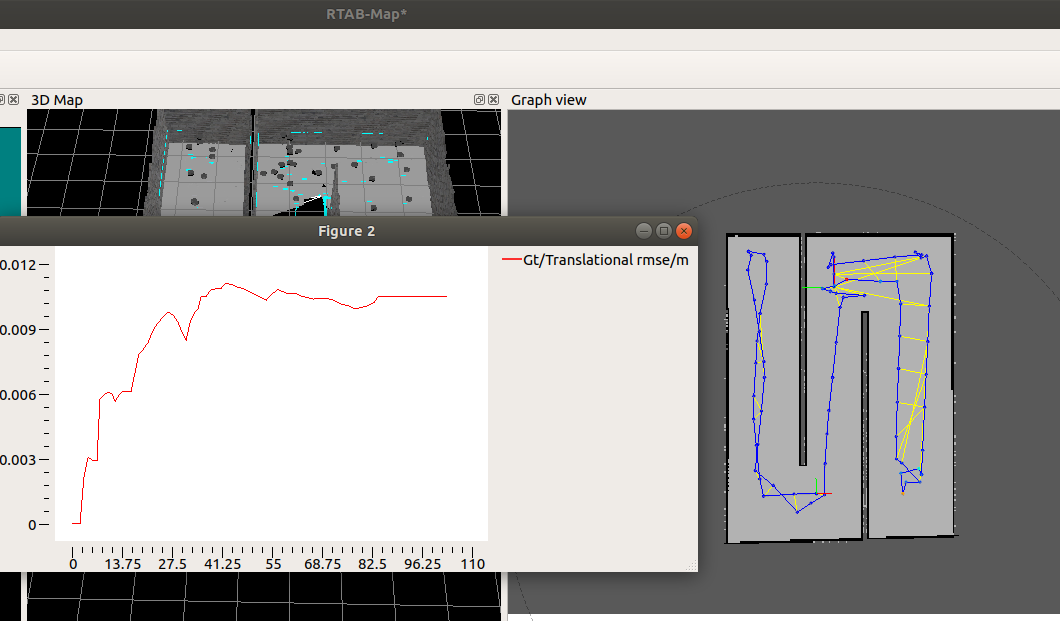
When opening the database in rtabmap-databaseViewer, you can show the Statistics panel to see the computed errors under Gt tab. You can plot the error over time by clicking the button next to the statistic (in screenshot below we can see that a loop closure occurred just before 170, causing a drop of error). Under the Graph view, you should see a gray path representing the ground truth along with the blue path representing the estimated trajectory. For convenience, you can also see the same RMSE computed under it for the current optimization iteration selected.
Another tool is rtabmap-report to export estimated and ground truth poses in RGB-D dataset format:
$ rtabmap-report --poses rtabmap.db
Database: rtabmap.db
    (164, s=1.000): error lin=0.020m (max=0.035m, odom=0.036m) ang=1.1deg, slam: avg=59ms (max=197ms) loops=36, odom: avg=70ms (max=100ms), camera: avg=19ms, map=285MB
This will create rtabmap_odom.txt, rtabmap_slam.txt and rtabmap_gt.txt that can be fed to RGB-D dataset's evaluation tool:
$ python evaluate_ate.py rtabmap_slam.txt rtabmap_gt.txt --plot ate.pdf
$ python evaluate_rpe.py rtabmap_odom.txt rtabmap_gt.txt --plot rpe.pdf --fixed_delta
EDIT2
The databases you shared in the comments are very difficult for visual loop closure detection as the same texture is seen everywhere, thus we cannot distinguish a place from another. No loop closures can be detected. Also the biggest problem is that you never revisit the same area with the same camera orientation.
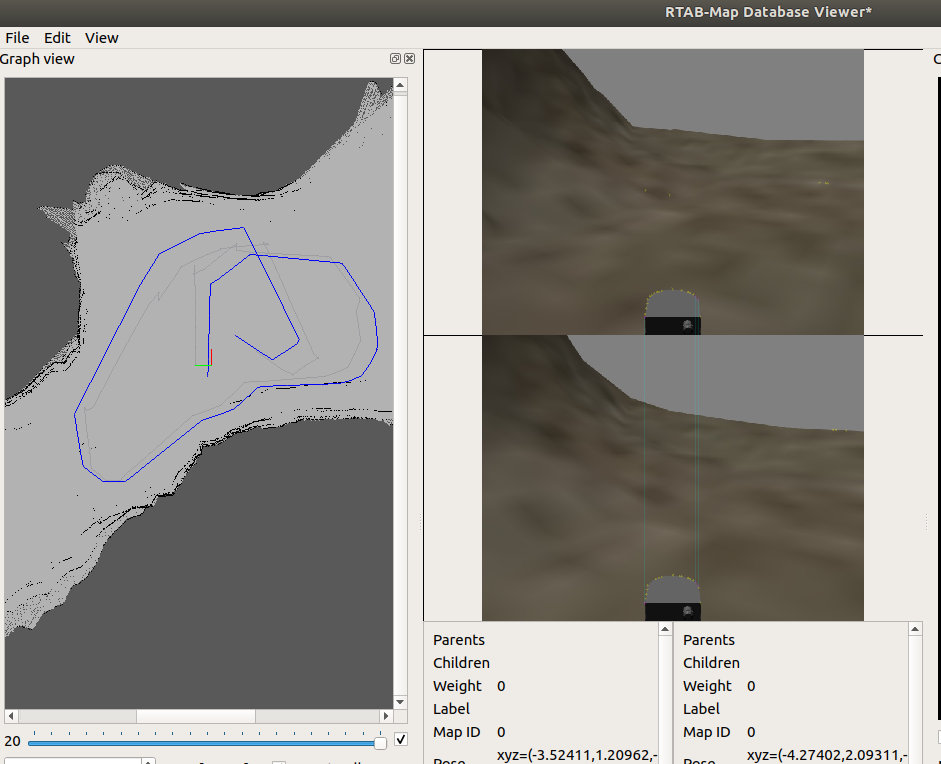
For the second map, you could however enable ICP refining to correct your odometry.
Before:
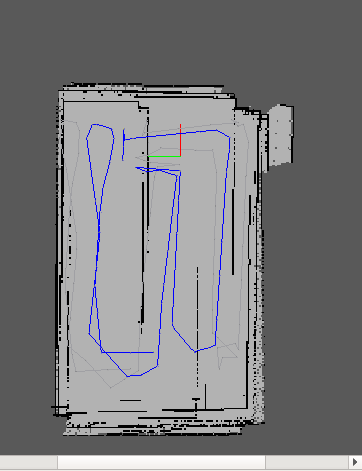
After:
Parameters (rtabmap should be built with libpointmatcher for those ICP parameters):
Icp/PM=true
Icp/MaxTranslation=2.00
Icp/MaxCorrespondenceDistance=0.75
Icp/PMOutlierRatio=0.9
Icp/PointToPlane=true
Reg/Strategy=1
RGBD/NeighborLinkRefining=true
RGBD/ProximityPathMaxNeighbors=5 ...
(more)


You want to get ground truth to compare it to the odometry you are getting using rtabmap?
yes, I want to plot them both. After getting a goal command, the robot navigates autonomously by generating the trajectory using rtabmap_ros. I want to plot that trajectory with the actual position of the robot in Gazebo (ground Truth) to compare the accuracy of the rtabmap_ros. I just do not know how to do that and which topics are involved.
You can take a look at this answer. And for plotting you can use rqt_plot I guess.