
Polynomial Curve as Marker (Similar to visualization msgs) in rviz
I have a polynomial curve fitted (pink colored) between two lanes in the image as given below. I have the world coordinates of the curve but there is no way to visualize it in RVIZ since the visualization msgs does not support curved shapes. Marker type Line Strip can do that to an extent but does not replicate the curve accurately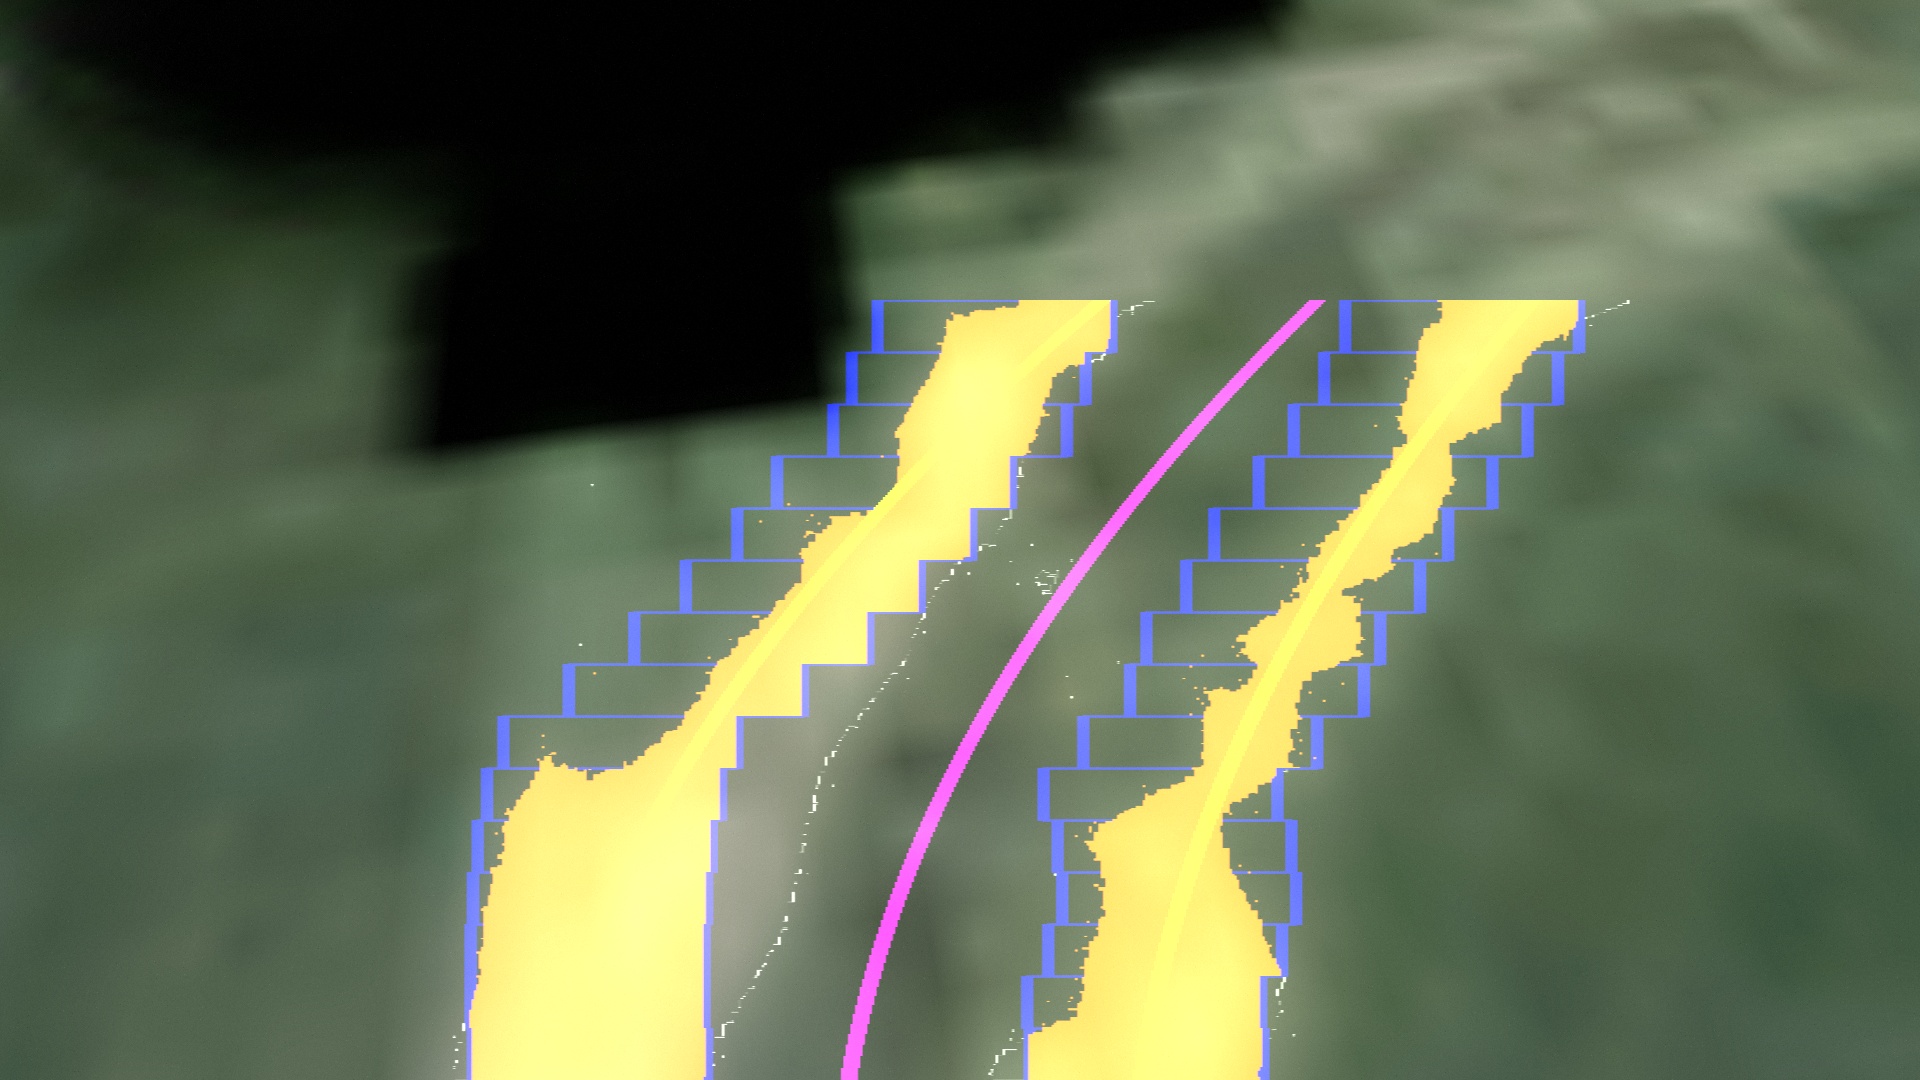 .
.
Is there any other ROS package which has curvature support or any other way that I can develop on the lines of visualization msgs indigenously?
Thanks in advance.

LineStrip with enough points would be my first suggestion. Any other way of doing this (writing a new RVIZ) plugin will be a lot of work for a minimal return. Is there a reason you can't simply enough enough points that it appears like a curve?
Line Strip will do but it won't be smoother as actual curve though. I looking to obtain the curve as an input for the autonomous navigation system not just for visualization. That's the reason.