
Reduce ROS2 memory usage
Hi,
I noticed that the memory used by a ROS2 process is really high.
For example running psrecord
$ psrecord --plot listener.png --include-children --duration 10 "ros2 run demo_nodes_cpp listener"
The result will show that a node with only a subscription to a String topic has a memory usage of more than 55 MB.
The same amount of memory can be checked using tools like free.
Running the same test with a different node
$ psrecord --plot listener.png --include-children --duration 10 "ros2 run image_tools showimage"
This executable instantiates a subscriber for images, resulting in more than 80 MB of memory.
Are these results consistent with your experience or am I doing something wrong? Is there a way to reduce the ROS2 memory usage?
EDIT:
I noticed that part of this memory is due to the execution of the node using the ROS2 CLI, the memory usage reduces when directly calling ./EXECUTABLE_NAME.
EDIT: I have further investigated this issue using valgrind. Thus, without considering the ROS2 CLI process or other things, creating a node with a subscription to an INT64 topic will allocate approx 14 MB.
Then I tried creating messages with bigger size (i.e. 0.01 MB, 1 MB, 2 MB, 4MB) and I found a dramatic proportion.
Array4MB.msg
byte[4000000] array
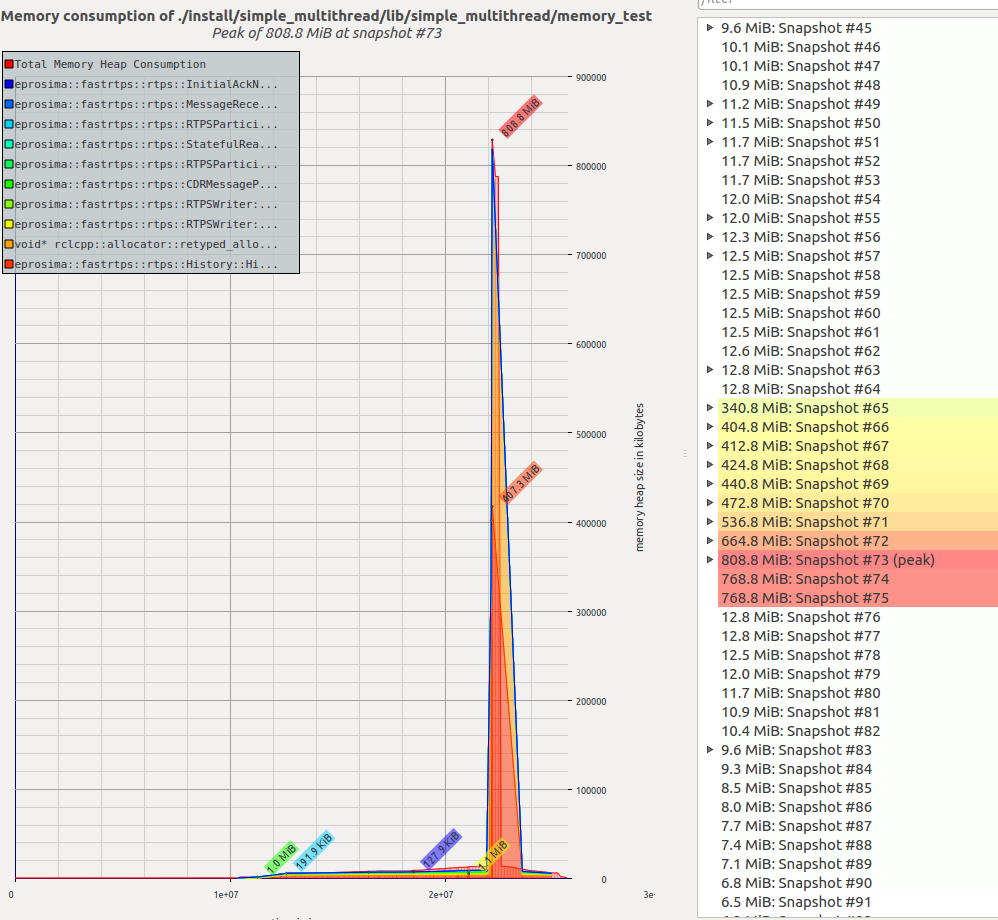
The memory allocated for a node with a subscription is approximately 200 TIMES the dimension of the message. Creating a node which subscribes to a topic where messages of fixed size 4 MB are published, will allocate 800 MB!!
I'm only instantiating the node, it's not spinning or doing anything else.
Thank you

Try
top -H -p PIDwhere PID is the process id of your node- see if there are particular threads that are using the bulk of the memory (though they are all named the same). I see a dozen or more threads per process even when using a single threaded executor, maybe each is taking a bunch of memoryI see 5 threads, each using 0.1% MEM. Ubuntu system monitor shows 6.2MB for the process.
valgrindandpsrecordshow 800MB. I trust the second as, if I try to run this node on a device with RAM 512MB it goes out of memory.Cross post https://discourse.ros.org/t/monitorin...
I was actually going to close this, as what I see from Valgrind for this particular example is completely different from what other tools show. However Valgrind is coherent with other methods when I use small message sizes.
Possibly related - cpu usage is high also https://answers.ros.org/question/3129...