ROS callback invoked faster than publishing rate
Hi all, My ROS node communicates with V-REP on the topic /vrep/visionSensorData to catch images coming from a vision sensor object of the scene. The publishing rate of this topic depends on the simulation time step, that in my scene is set to 50ms, so the publishing rate is 20 Hz. As a further proof of that, I checked this value on my terminal by typing the command rostopic hz /vrep/visionSensorData.
In addition, in order to evaluate the processing time of my algorithm, I also measured the actual elapsed time between two consecutive callbacks of the topic, expecting that it was higher than 50ms because of the required time for image processing.
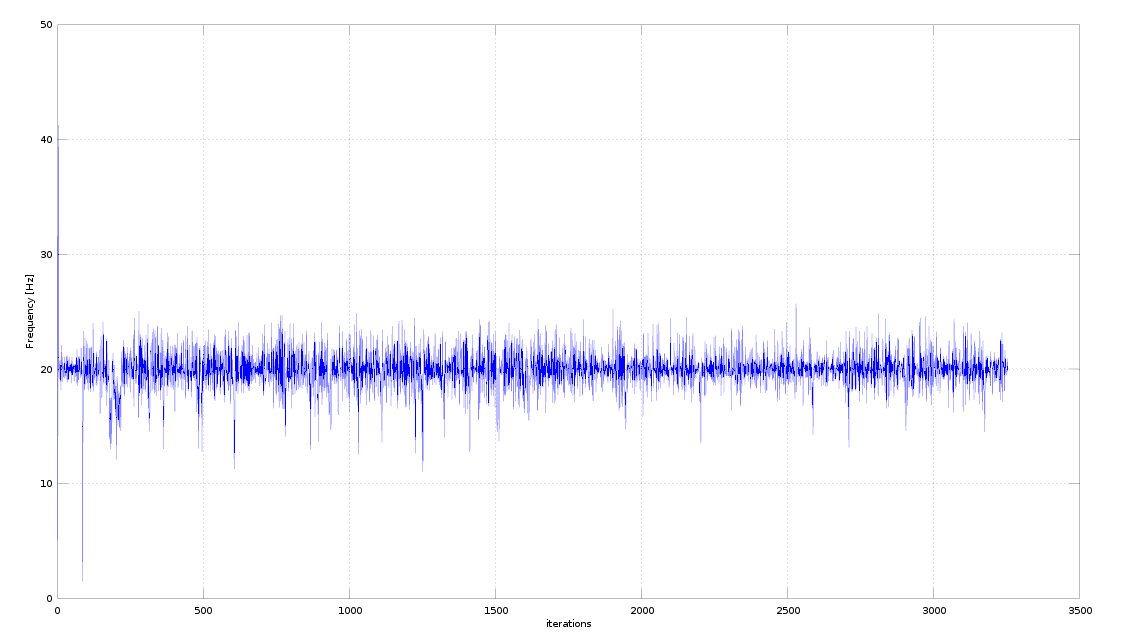
Well, my measurements revealed that in some iterations the elapsed time is even lower, resulting into a frequency higher than the claimed publishing rate of 20Hz. I cannot attach a plot of the measured frequency because I have not enough points on this forum.
Can anyone explain me why this happens? Do I have to conclude that the publishing rate is not always the same, but it can vary in a fixed range?
EDIT 1: I tried to set this option tcpNoDelay() as suggested, but I still measure frequencies higher than 20Hz. My subscriber is an image_transport subscriber, so following the documentation I added this option in the following way (hope it's well written):
image_vrep_sub_ = it_.subscribe("/vrep/visionSensorData",1, &ImageConverter::imageCb, this, image_transport::TransportHints("raw",ros::TransportHints().tcpNoDelay()));
EDIT 2: yes, actually my measurements are an average of 20 Hz, so they could be consistent with rostopic hz command, but I didn't expect it could change this way. Here is the plot as requested, thanks for the bump. So do you think it is a reasonable behaviour?
Ah, I forgot to say that I tried to set the parameter use_sim_time, but this prevents me to use keyboard inputs through the /keyboard topic. Should I set something else to make it work?

Thanks in advance for your answers


Did you compare behavior before and after using tcpNoDelay()? I think the plot looks reasonable. If you require hard real-time guarantees, you might want to use a corresponding Kernel, scheduling policy and/or OROCOS/ROS integration.
The update plot looks reasonable to me. The variation you see corresponds to about 50ms +/- 10ms, which is pretty typical for non-realtime applications on Linux.