
The site is read-only. Please transition to use Robotics Stack Exchange
| ROS Resources: Documentation | Support | Discussion Forum | Index | Service Status | ros @ Robotics Stack Exchange |
| 2022-05-29 19:40:00 -0500 | received badge | ● Self-Learner (source) |
| 2022-05-29 19:39:57 -0500 | received badge | ● Nice Question (source) |
| 2015-04-06 04:59:52 -0500 | commented question | Has anyone integrated ROS with Unity 3d? Is there anyone who has got his/her hands dirty on that (viz. ROS+Unity3D) ? |
| 2014-12-29 17:21:06 -0500 | received badge | ● Good Answer (source) |
| 2014-08-06 00:03:36 -0500 | received badge | ● Nice Answer (source) |
| 2014-04-17 04:19:03 -0500 | received badge | ● Notable Question (source) |
| 2014-04-17 04:19:03 -0500 | received badge | ● Famous Question (source) |
| 2014-03-26 06:34:20 -0500 | received badge | ● Famous Question (source) |
| 2014-01-31 08:58:29 -0500 | received badge | ● Necromancer (source) |
| 2014-01-28 17:23:24 -0500 | marked best answer | problem with pr2 kinect model Hello everyone, I am trying to launch
However, the kinect on top of the pr2 seems huge. I was able to launch the same file a few days ago, I guess something changed with the model. Anyone happen to realize similar problem? Thanks in advance Cheers |
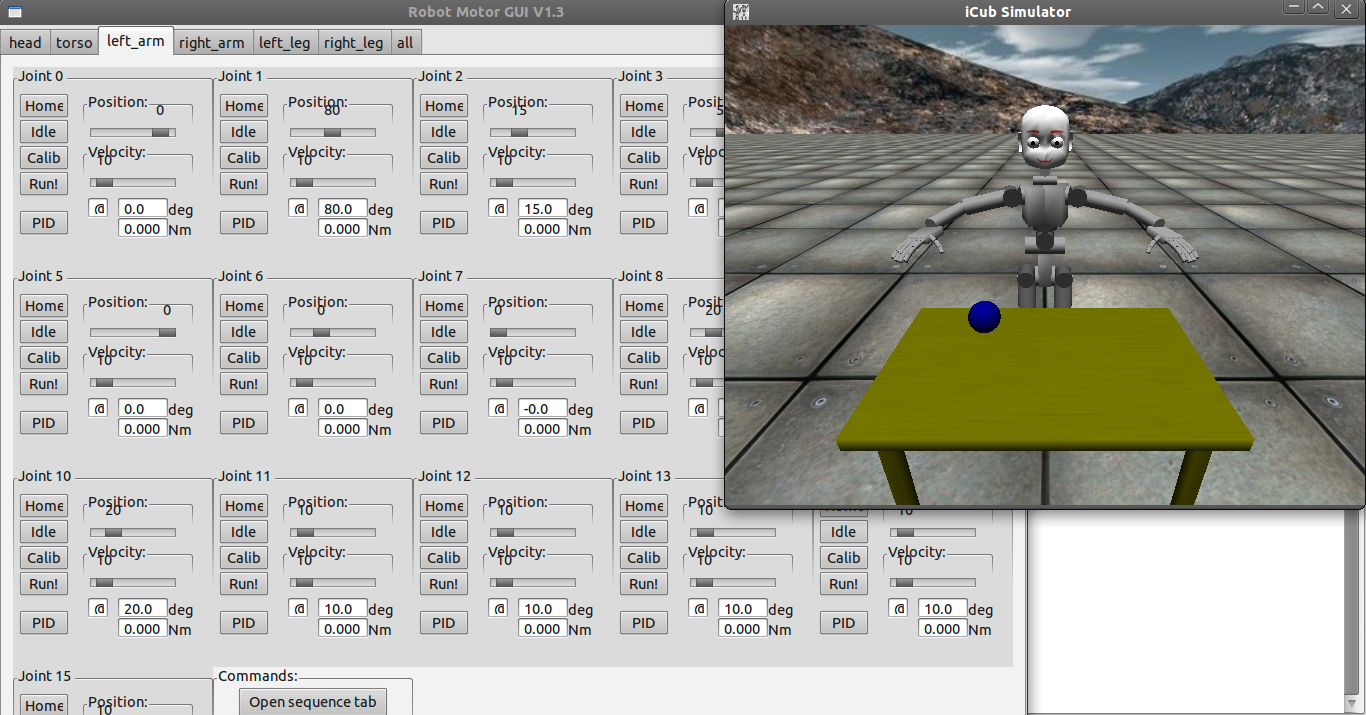
| 2014-01-28 17:22:32 -0500 | marked best answer | PR2 motor control GUI/interface Hi folks, I've been looking around for an easy-to-use GUI-like interface to control joint angles of the PR2, like we have for iCub. Do you know any tool that can be used in this manner? Thanks in advance.
|
| 2014-01-28 17:22:20 -0500 | marked best answer | observation buffer has not been updated Hi folks, There is one node publishing PointCloud type sensor messages to 10 different topics (e.g. /B0/motion_planner/pointcloud/map_state) at 60Hz. And there might be 10 nodes(one for each robot), subscribed to the corresponding sensor message. There is a transform_broadcaster inside this node that publishes all sensor messages which broadcasts the transforms of the /field to each robot's base link such as /B0/motion_planner/base_link at a rate of 60Hz. PointClouds are published with the frame id of "/field", which is already set with the parameter "sensor_frame" correctly (checked it by rosparam get). I can visualize the sensor messages and transforms in rviz. And if "All topics" is clicked on the rxgraph GUI, I can see that the sensor messages are connected to the motion_planner nodes that each one contains a Costmap2DROS object(if "All topics" is not clicked, it can't show the connection, don't know why). When I run a motion_planner, I get the following warning: The /B0/motion_planner/pointcloud/map_state observation buffer has not been updated for X seconds, and it should be updated every 0.03 seconds. Which keeps showing up, hence X gets larger and larger. Nothing changes, if I call the updateMap inside the while loop manually. It seems costmap object doesn't receive the pointcloud msg. Because it says in the docs that it automatically subscribes to the sensor topic and updates the sensor information by itself. I also set the frame_id, seq, and stamp before publishing the PointCloud message. Any help would greatly be appreciated... Cheers |
| 2014-01-28 17:22:19 -0500 | marked best answer | Trajectory planner for a multi robot omniwheeled soccer system Hi folks, Sorry for such a general question but I'm kind of in a hurry for RoboCup'11. I was planning to write my own Dynamic Safety Search (J.R.Bruce ,2006) algorithm to control a multi robot omniwheeled soccer system, then I came across with the DWA of base_local_planner. In principle, DSS is very similar to DWA, so I am planning to go with TrajectoryPlannerROS class. So, my questions are as follows:
Thank you for your assistance... Cheers |
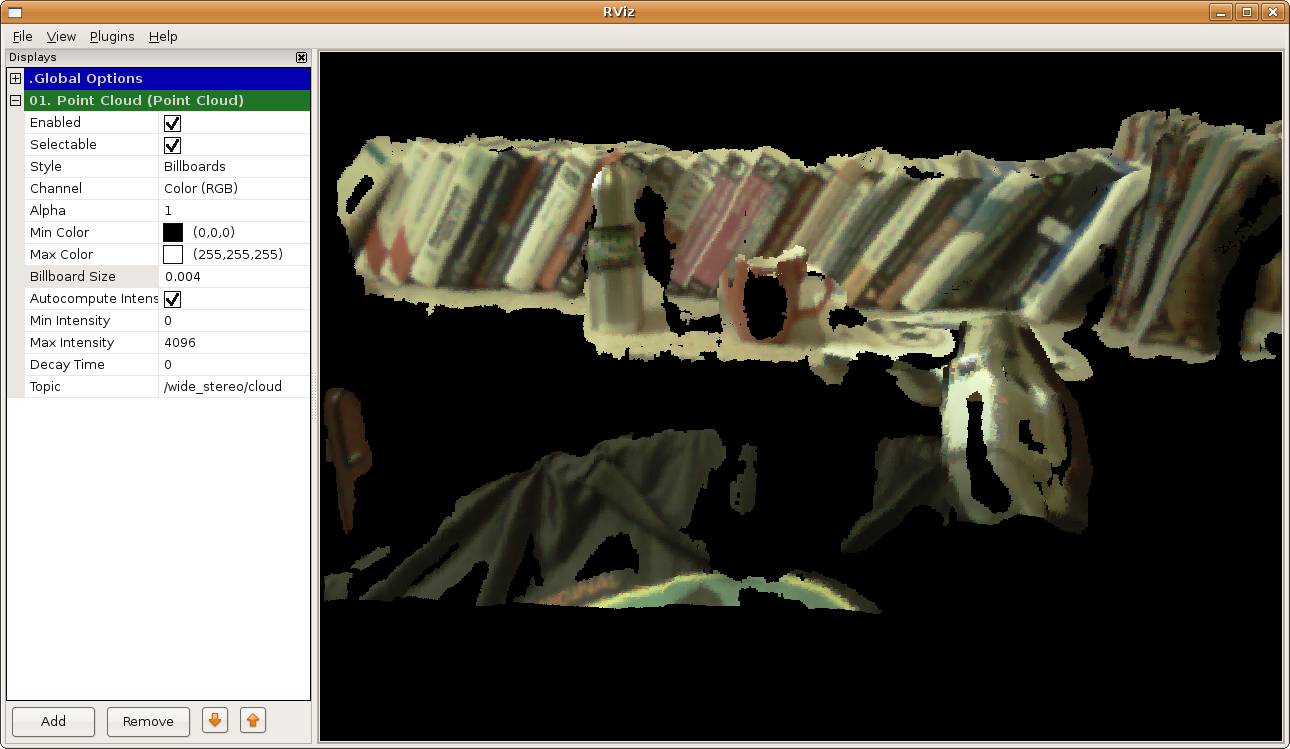
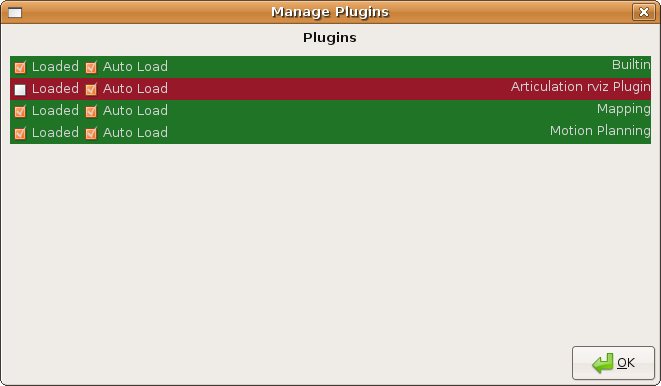
| 2014-01-28 17:21:52 -0500 | marked best answer | How to visualize colored pointclouds in rviz? Hi folks, I want to show rgb values of a point cloud in rviz where I store some information inside the rgb channels. However, there is not any choice named "channel", as it is shown here. I've tried to add various builtin display types, such as PointCloud2, PointCloud and even LaserScan but none of them contains a channel field. I've tried to add plugins as it is mentioned in this question. But I couldn't add any plugin via the Plugins->Manage tab of the rviz. So, I cannot obtain something like this. I've checked the rviz folder in case there might be a folder named plugins or anything related to the plugins but no success. I tried rviz --help but no information there also. Can someone please tell me how can we do such a simple thing:) ? Thanks |
| 2014-01-28 17:21:42 -0500 | marked best answer | Decomposing objects into their structural components in pcl Hey guys, Do you know any pcl example or source code that does decompose objects into their components by using any kind of a method? I know that there are SAC based segmentation methods that does primitive shape fitting but I don't think they are able to extract mug handles or other similar sub-components. Well you can get the handle after extracting the cylinder-like mug component, but I need sth that is able cluster other smaller parts also. I need this just for visualization purposes, it is not required to run online/real time, it is adequate to be able to work on stationary scenes/inputs. Thanks |
| 2014-01-28 17:21:38 -0500 | marked best answer | How to know which points pcl::PassThrough and pcl::StatisticalOutlierRemoval removes? Hi, I would like to know which point is removed/filtered out from an input cloud after applying pcl::PassThrough and pcl::StatisticalOutlierRemoval filters. What I mean by "which point" is the x and y index values of a 3D Point in the sensor plane, or simply the index value of the point. I have checked pcl::ExtractIndices and pcl_base.h and many other source files, but I couldn't find an easy way to do that. Thanks... |
| 2014-01-28 17:21:35 -0500 | marked best answer | How to visualize surface normals as Marker::Arrow for each point in rviz? Hi, I would like to show the surface normals of a point cloud in rviz. Below is what I was trying:
Whenever it publishes the markerarray, RAM blows up and swap is heavily used and PC stalls there. What do you think I am doing very badly wrong here? Or isn't it possible to visualize that many arrows (25344 of them) in the rviz? If so, should I use other tools coming with PCL? Thanks a lot... -Kadir- |
| 2013-09-10 03:00:45 -0500 | received badge | ● Notable Question (source) |
| 2013-07-23 01:22:19 -0500 | received badge | ● Popular Question (source) |
| 2013-07-19 07:21:57 -0500 | asked a question | changing rviz display orientation Is is possible to change rviz's display view as we can change the orientation of the grid plane? For instance, I want to change XYOrbit to XZOrbit so that the interactions with the display can become more intuitive when I use XZ plane for the grid placement. |
| 2013-05-04 13:32:09 -0500 | received badge | ● Good Question (source) |
| 2012-12-11 09:12:46 -0500 | received badge | ● Popular Question (source) |
| 2012-12-11 09:12:46 -0500 | received badge | ● Notable Question (source) |
| 2012-12-11 09:12:46 -0500 | received badge | ● Famous Question (source) |
| 2012-12-04 23:28:06 -0500 | marked best answer | How to clear older costmap just before updating the map? Hi, What I'm trying to do is putting a rolling window on top of each robot (5 robots in total), then inflating the points representing each obstacle near to the robot of interest as soon as a new sensor data is received, but the map will be reset after a new sensor data comes (clearing). Here are some of the important parameter settings: When I run the simulation, everything seems to be properly set, but somehow obstacles are stored, and they stay there all the time. I've read costmap doc and nav tutorials many times, I checked if the parameters are set, I debugged the costmap and observation buffer source codes and verified that buffer is actually cleared(since observation_persistence is set to 0.0). I thought making the sensor as "marking+clearing" will help it to overwrite already obtained data automatically. But since it is set as rolling_window with the width and height of 1 meter, sensor couldn't clear the inflated regions since the origin of the sensor becomes outside of the window. "The origin for the sensor at (0.00, 0.00) is out of map bounds. So, the costmap cannot raytrace for it". Having set the raytrace_range 1.0 as in the case of obstacle_range didn't change anything. I was hoping that somehow it will be handled automatically that the sensor data inside the rolling window will be updated and cleared automatically. Then, why still see the traces of the dynamic objects, as it is shown in this video? In this video, there are 5 static yellow robots, and five dynamic blue robots, one of which is creating a costmap for itself, and the point clouds being sent to the costmap is shown with red, orange points are obstacles, green regions are the inflated obstacles. Many thanks in advance.. |
| 2012-11-30 03:17:21 -0500 | commented answer | How to simultate Nao robot (Alebaran) in Gazebo? Webots has ROS controller interface for a while. |
| 2012-11-27 00:31:56 -0500 | received badge | ● Popular Question (source) |
| 2012-11-27 00:31:56 -0500 | received badge | ● Notable Question (source) |
| 2012-11-27 00:31:56 -0500 | received badge | ● Famous Question (source) |
 ROS Answers is licensed under Creative Commons Attribution 3.0 Content on this site is licensed under a Creative Commons Attribution Share Alike 3.0 license.