| 2023-04-04 16:15:39 -0500 | marked best answer | Why doesn't ros2 pkg list show the packages that I built? I am trying to build 2 new nodes, based on the minimal_publisher and minimal_subscriber examples provided by the ros2_ws overlay workspace. I have copied and pasted my code from the examples, with the intention to change them in the near future. I then changed the names of the source files, and the name of the package, among other names. To ensure a successful build, I made several corresponding changes to the CMakeLists.txt and package.xml of each package as well. Both packages built successfully. However, the only way I can run them is if I locate the binary files in the install directory of the ros2_ws workspace and run them from there. If I run ros2 pkg list or ros2 pkg executables, none of my packages show up there. Predictably, when I run ros2 run publisht tester_publisht (publisht is the name of my pkg and tester_publisht is the name of the executable) , it just shows Package 'publisht' not found. Why is it that ros2 pkg cannot find my package? My publisht package in the install directory of ros2_ws: publisht
├── lib
│ └── publisht
│ └── tester_publisht
└── share
├── ament_index
│ └── resource_index
│ ├── package_run_dependencies
│ │ └── publisht
│ ├── packages
│ │ └── publisht
│ └── parent_prefix_path
│ └── publisht
├── colcon-core
│ └── packages
│ └── publisht
└── publisht
├── cmake
│ ├── publishtConfig.cmake
│ └── publishtConfig-version.cmake
├── environment
│ ├── ament_prefix_path.sh -> /home/user/ros2_ws/src/ament/ament_cmake/ament_cmake_core/cmake/environment_hooks/environment/ament_prefix_path.sh
│ └── path.sh -> /home/user/ros2_ws/src/ament/ament_cmake/ament_cmake_core/cmake/environment_hooks/environment/path.sh
├── hook
│ ├── cmake_prefix_path.ps1
│ └── cmake_prefix_path.sh
├── local_setup.bash
├── local_setup.sh
├── local_setup.zsh
├── package.bash
├── package.ps1
├── package.sh
├── package.xml
└── package.zsh
My tester directory in ros2_ws/src, which contains the source code for the 2 nodes I intend to make, publisht and subscribet: tester
├── publisht
│ ├── CMakeLists.txt
│ ├── package.xml
│ ├── publisht.cpp
│ └── README.md
├── README.md
└── subscribet
├── CMakeLists.txt
├── package.xml
├── README.md
└── subscribet.cpp
My CMakeLists.txt for publisht: cmake_minimum_required(VERSION 3.5)
project(publisht)
# Default to C++14
if(NOT CMAKE_CXX_STANDARD)
set(CMAKE_CXX_STANDARD 14)
endif()
if(CMAKE_COMPILER_IS_GNUCXX OR CMAKE_CXX_COMPILER_ID MATCHES "Clang")
add_compile_options(-Wall -Wextra -Wpedantic)
endif()
find_package(ament_cmake REQUIRED)
find_package(rclcpp REQUIRED)
find_package(std_msgs REQUIRED)
add_executable(tester_publisht publisht.cpp)
ament_target_dependencies(tester_publisht rclcpp std_msgs)
install(TARGETS
tester_publisht
DESTINATION lib/${PROJECT_NAME}
)
ament_package()
And my package.xml for publisht: <?xml version="1.0"?>
<?xml-model href="http://download.ros.org/schema/package_format2.xsd" schematypens="http://www.w3.org/2001/XMLSchema"?>
<package format="2">
<name>publisht</name>
<version>0.6.3</version>
<description>Ready to publish to topics from selected nodes</description>
<maintainer email="MAINTAINER@u.uni.edu">MAINTAINER</maintainer>
<license>Apache License 2.0</license>
<author>AUTHOR</author>
<buildtool_depend>ament_cmake</buildtool_depend>
<build_depend>rclcpp</build_depend>
<build_depend>std_msgs</build_depend>
<exec_depend>rclcpp</exec_depend>
<exec_depend>std_msgs</exec_depend>
<export>
<build_type>ament_cmake</build_type>
</export>
</package>
|
| 2020-04-11 08:09:27 -0500 | received badge | ● Famous Question
(source)
|
| 2020-02-13 01:22:41 -0500 | asked a question | [ROS2] Unable to view topic across 2 machines [ROS2] Unable to view topic across 2 machines
I have 2 devices, a Raspberry Pi 3+ on a TurtleBot3 burger, and a Remote P |
| 2020-01-22 18:39:09 -0500 | received badge | ● Notable Question
(source)
|
| 2020-01-22 18:39:09 -0500 | received badge | ● Famous Question
(source)
|
| 2019-11-14 11:46:04 -0500 | received badge | ● Famous Question
(source)
|
| 2019-11-14 11:46:04 -0500 | received badge | ● Notable Question
(source)
|
| 2019-10-31 02:45:38 -0500 | received badge | ● Famous Question
(source)
|
| 2019-10-22 16:45:20 -0500 | received badge | ● Famous Question
(source)
|
| 2019-08-26 08:45:52 -0500 | received badge | ● Famous Question
(source)
|
| 2019-08-13 17:20:59 -0500 | received badge | ● Famous Question
(source)
|
| 2019-08-06 13:16:30 -0500 | received badge | ● Popular Question
(source)
|
| 2019-07-30 12:04:40 -0500 | marked best answer | Enabling statistics in rqt_graph for ROS2 I am using ROS2 Crystal Clemmys in Ubuntu 18.04, and am successfully running rqt_graph gui on screen by using the command rqt_graph --force-discover (I had to use --force-discover as qt_gui_main() found no plugin matching "rqt_graph.ros_graph.RosGraph") I would like to enable statistics on my graph, so that I can observe the publish frequency (in Hz) and the average age of message (in ms). In ROS1 the command is rosparam set enable_statistics true, as shown in the tutorial for rqt_graph here. However, I am not sure what the command is for ROS2. I tried this: user@ubuntu:~$ ros2 param set enable_statistics true
usage: ros2 param set [-h] [--spin-time SPIN_TIME] [--include-hidden-nodes]
node_name name value
ros2 param set: error: the following arguments are required: value
It couldn't find the parameter enable_statistics. So I went to find out the actual name of the parameter by: user@ubuntu:~$ ros2 param list
./rqt_gui_py_node_11381:
There were no parameters for enabling statistics at all. May I know the proper way of enabling statistics for rqt_graph in ROS2? Edit: I think I keyed in another correct command: user@ubuntu:~$ ros2 param set /rqt_gui_py_node_11381 /enable_statistics true
Set parameter successful
While the parameter has been found, still no statistics show up on the rqt_graph, even after I clicked on the refresh button. How can I make the statistics appear, like in the picture in the tutorial? |
| 2019-07-29 06:13:54 -0500 | received badge | ● Famous Question
(source)
|
| 2019-07-18 19:00:53 -0500 | received badge | ● Notable Question
(source)
|
| 2019-07-17 17:18:40 -0500 | received badge | ● Popular Question
(source)
|
| 2019-07-16 06:43:13 -0500 | received badge | ● Popular Question
(source)
|
| 2019-07-16 06:43:13 -0500 | received badge | ● Notable Question
(source)
|
| 2019-07-10 10:28:49 -0500 | received badge | ● Notable Question
(source)
|
| 2019-07-09 16:06:04 -0500 | received badge | ● Notable Question
(source)
|
| 2019-07-08 17:44:02 -0500 | received badge | ● Popular Question
(source)
|
| 2019-06-30 20:17:09 -0500 | commented answer | [ROS2] What does the "discovery multicast port" do? |
| 2019-06-28 10:08:22 -0500 | commented answer | [ROS2] What does the "discovery multicast port" do? Thank you for pointing out the problem of relevance with regard to 'inner-workings-type' questions. I understand that RO |
| 2019-06-28 03:54:23 -0500 | commented answer | [ROS2] What does the "discovery multicast port" do? Thank you.
I understand that the user multicast port is not necessarily 7401, but my domain ID is definitely 0 at the |
| 2019-06-28 03:32:07 -0500 | marked best answer | [ROS2] What does the "discovery multicast port" do? According to this, RTI Connext in ROS2 uses four ports for UDP transport. Each port has its own purpose: discovery multicast, user multicast, discovery unicast, and user unicast. As far as I could tell, the other DDS implementations use roughly the same ports for the same purposes. What I want to know is what these mean in the context of ROS2? Like: - What does the discovery multicast port do? My impression from its name is that it serves as a socket for all the ros2_daemon to listen for all the nodes and take in any new nodes.
- I have no idea what the user multicast port does, because it doesn't show up when I use
lsof -iUDP or ss -uap. Apparently 7401 is the port number reserved for this function but no process is using this port on my machine. - I also do not know what the user unicast and discovery unicast ports do. I used WireShark to examine the UDP/RTPS traffic in my ROS2 communication graph. Apparently sometimes these ports receive packets from ephemeral ports from other nodes, at other times they do not send or receive any packets at all. So I do not understand what purpose these ports serve.
- On the use of WireShark, I also do not understand my findings when investigating the traffic going to the discovery multicast port.
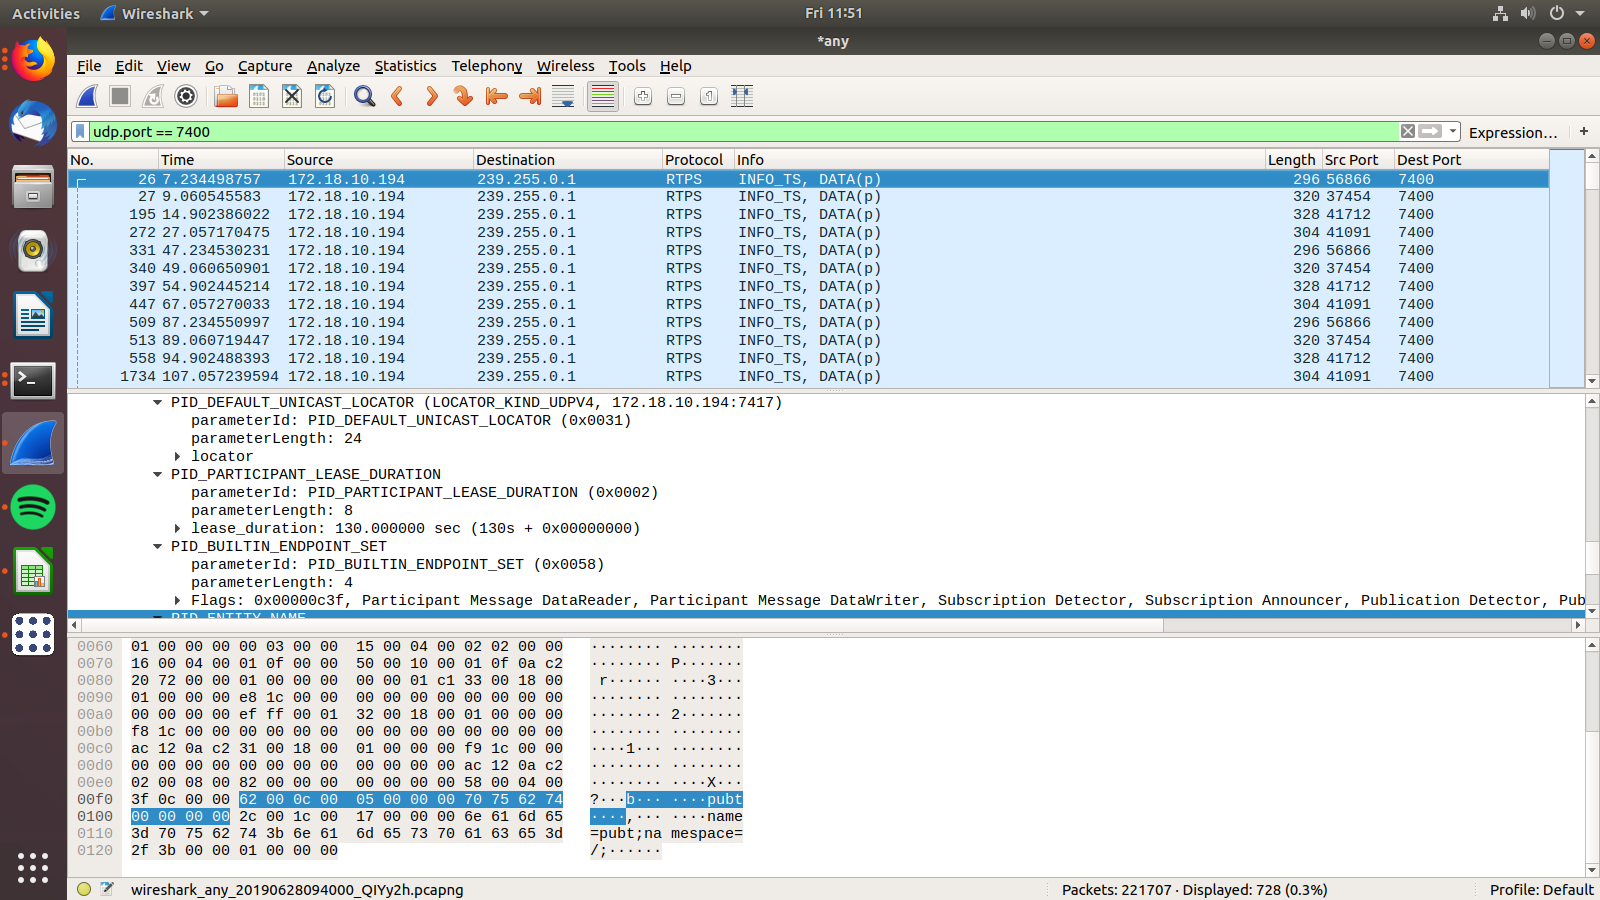 The large numbers are ephemeral ports from the rest of the nodes in the computational graph, like rqt_gui_py_node, _ros2cli_daemon_0 among other nodes that I created myself. However, they are all sending DATA and INFO_TS to port 7400. I feel that if the discovery multicast node is for discovering new nodes and keeping track of existing ones, they should be sending messages like ACKNACK or HEARTBEAT, according to the legend here. May I have a simple explanation of what each ports do. or perhaps a link to more documentation? Thank you. |
| 2019-06-28 03:31:50 -0500 | commented answer | [ROS2] What does the "discovery multicast port" do? Thank you.
I understand that the user multicast port is not necessarily 7401, but my domain ID is definitely 0 at the t |
| 2019-06-27 23:21:34 -0500 | asked a question | [ROS2] What does the "discovery multicast port" do? [ROS2] What does the "discovery multicast port" do?
According to this, RTI Connext in ROS2 uses four ports for UDP trans |
| 2019-06-20 09:07:51 -0500 | received badge | ● Notable Question
(source)
|
| 2019-06-20 09:07:51 -0500 | received badge | ● Famous Question
(source)
|
| 2019-06-19 20:30:55 -0500 | marked best answer | Difference between gzclient, gzserver and gazebo When I run ros2 launch turtlebot3_gazebo turtlebot3_world.launch.py, gazebo is launched. Then, I run: user@ubuntu:~/ros2_ws$ lsof -iUDP | grep gazebo
gazebo 27889 user 9u IPv4 496548 0t0 UDP *:7400
gazebo 27889 user 10u IPv4 496554 0t0 UDP *:7418
gazebo 27889 user 11u IPv4 496560 0t0 UDP *:7419
gazebo 27889 user 12u IPv4 496563 0t0 UDP *:52459
user@ubuntu:~/ros2_ws$ lsof -iUDP | grep gzserver
gzserver 27902 user 9u IPv4 496548 0t0 UDP *:7400
gzserver 27902 user 10u IPv4 496554 0t0 UDP *:7418
gzserver 27902 user 11u IPv4 496560 0t0 UDP *:7419
gzserver 27902 user 12u IPv4 496563 0t0 UDP *:52459
gzserver 27902 user 15u IPv4 496615 0t0 UDP *:7400
gzserver 27902 user 16u IPv4 496623 0t0 UDP *:7422
gzserver 27902 user 17u IPv4 496631 0t0 UDP *:7423
gzserver 27902 user 18u IPv4 496634 0t0 UDP *:48586
gzserver 27902 user 41u IPv4 497324 0t0 UDP *:11317
gzserver 27902 user 42u IPv4 497329 0t0 UDP *:11318
gzserver 27902 user 52u IPv4 495547 0t0 UDP *:7400
gzserver 27902 user 53u IPv4 495555 0t0 UDP *:7424
gzserver 27902 user 54u IPv4 495563 0t0 UDP *:7425
gzserver 27902 user 55u IPv4 495566 0t0 UDP *:38077
gzserver 27902 user 62u IPv4 498712 0t0 UDP *:7400
gzserver 27902 user 63u IPv4 498720 0t0 UDP *:7426
gzserver 27902 user 64u IPv4 498728 0t0 UDP *:7427
gzserver 27902 user 65u IPv4 498731 0t0 UDP *:48999
gzserver 27902 user 72u IPv4 498740 0t0 UDP *:7400
gzserver 27902 user 73u IPv4 498748 0t0 UDP *:7428
gzserver 27902 user 74u IPv4 498756 0t0 UDP *:7429
gzserver 27902 user 75u IPv4 498759 0t0 UDP *:45287
gzserver 27902 user 82u IPv4 495579 0t0 UDP *:7400
gzserver 27902 user 83u IPv4 495587 0t0 UDP *:7430
gzserver 27902 user 84u IPv4 495595 0t0 UDP *:7431
gzserver 27902 user 85u IPv4 495598 0t0 UDP *:49441
user@ubuntu:~/ros2_ws$ lsof -iUDP | grep gzclient
gzclient 27903 user 9u IPv4 496548 0t0 UDP *:7400
gzclient 27903 user 10u IPv4 496554 0t0 UDP *:7418
gzclient 27903 user 11u IPv4 496560 0t0 UDP *:7419
gzclient 27903 user 12u IPv4 496563 0t0 UDP *:52459
gzclient 27903 user 24u IPv4 497351 0t0 UDP *:11317
gzclient 27903 user 25u IPv4 497356 0t0 UDP *:11318
What is the difference between gzclient, gzserver, gazebo? I understand that gzclient is the gazebo GUI, but I don't understand why gazebo pops up as another process. Why does gzclient and gazebo share some same ports as well? Also, why does gzserver use so many ports? Is it because it is responsible for spinning up several nodes in the turtlebot3_world.launch.py file? |
| 2019-06-17 14:26:12 -0500 | received badge | ● Popular Question
(source)
|
| 2019-06-17 05:22:19 -0500 | received badge | ● Popular Question
(source)
|
| 2019-06-17 03:38:34 -0500 | commented question | Difference between gzclient, gzserver and gazebo Sure. I will link my question here if it is answered on Gazebo Answers. Thank you.
|
| 2019-06-17 03:38:34 -0500 | received badge | ● Commentator
|
| 2019-06-17 02:41:38 -0500 | asked a question | Difference between gzclient, gzserver and gazebo Difference between gzclient, gzserver and gazebo
When I run ros2 launch turtlebot3_gazebo turtlebot3_world.launch.py, ga |
| 2019-06-17 00:55:12 -0500 | commented answer | [ROS2] Finding the originating socket for a ROS2 node Oh wait, never mind. According to https://community.rti.com/forum-topic/how-understand-number-ports-used-dds-context-app |
| 2019-06-16 22:26:37 -0500 | commented answer | [ROS2] Finding the originating socket for a ROS2 node Okay, I now understand what is 7400, 7412 and 7413. However, I still don't understand what is 41004, or any of the large |
| 2019-06-16 20:35:37 -0500 | marked best answer | [ROS2] Finding the originating socket for a ROS2 node I have created my own little node called tester_publisht, and am trying to find the originating socket of the node. However, the node is using 4 separate ports, and I have no idea what the output means. user@ubuntu:~$ lsof -iUDP
COMMAND PID USER FD TYPE DEVICE SIZE/OFF NODE NAME
spotify 2067 user 92u IPv4 276438 0t0 UDP *:57621
spotify 2067 user 108u IPv4 276451 0t0 UDP *:1900
spotify 2067 user 128u IPv4 276452 0t0 UDP *:55193
tester_pu 9642 user 6u IPv4 241204 0t0 UDP *:7400
tester_pu 9642 user 7u IPv4 241207 0t0 UDP *:7412
tester_pu 9642 user 8u IPv4 241210 0t0 UDP *:7413
tester_pu 9642 user 9u IPv4 241213 0t0 UDP *:41004
rqt_graph 14766 user 24u IPv4 243242 0t0 UDP *:7400
rqt_graph 14766 user 25u IPv4 243246 0t0 UDP *:7414
rqt_graph 14766 user 26u IPv4 243250 0t0 UDP *:7415
rqt_graph 14766 user 27u IPv4 243253 0t0 UDP *:39130
_ros2_dae 19978 user 6u IPv4 250922 0t0 UDP *:7400
_ros2_dae 19978 user 7u IPv4 250927 0t0 UDP *:7416
_ros2_dae 19978 user 8u IPv4 250932 0t0 UDP *:7417
_ros2_dae 19978 user 9u IPv4 250935 0t0 UDP *:36155
tester_publisht, rqt_graph and _ros2_daemon are the nodes that are running (sorry about Spotify :) ).
Running ros2 node list -a reveals the three nodes above, and running ros2 topic list returns /clock (the topic that tester_publisht is publishing to), /parameter_events and /rosout. I tried to listen in on the ports for tester_publisht, but was only able to listen onto port 7400. The rest (7412, 7413, and 41004) could not be listened to: user@ubuntu:~$ nc -lvu 7400
Listening on [0.0.0.0] (family 0, port 7400)
Connection from ubuntu 39130 received!
RTPS����
®9� �f�]�̓K����������������P��
®9���3�������2������
�1������
��X�?
b��rqt_gui_py_node_14766,,(name=rqt_gui_py_node_14766;namespace=/;�^C
user@ubuntu:~$ nc -lvu 7412
nc: Address already in use
user@ubuntu:~$ nc -lvu 7413
nc: Address already in use
user@ubuntu:~$ nc -lvu 41004
nc: Address already in use
However, port 7400 is also shared with the other two nodes rqt_graph and _ros2_daemon, as shown in the first code block. So I don't really understand what is the significance of port 7400. And also, which is the originating socket for tester_publisht, or for each of the nodes for that matter? |

 ROS Answers is licensed under Creative Commons Attribution 3.0 Content on this site is licensed under a Creative Commons Attribution Share Alike 3.0 license.