ROS Resources: Documentation | Support | Discussion Forum | Index | Service Status | ros @ Robotics Stack Exchange
Ask Your Question
1

How to access executable for ComposableNodeContainer for gdb debugging?

asked 2022-09-29 16:32:27 -0500

jd2548 gravatar image

updated 2022-09-29 16:34:43 -0500

I have a .py launch file that defines two composable node descriptions: desc1 and desc2, each of which describe two nodes that are already built and registered as

rclcpp_components_register_node(node1
  PLUGIN "node1NS::node1node"
  EXECUTABLE node1_node
)

and

rclcpp_components_register_node(node2
  PLUGIN "node2NS::node2node"
  EXECUTABLE node2_node
)

in their respective CMakeLists.txt files

The .py launch file then uses the two descriptions to create a ComposableNodeContainer like so:

container = ComposableNodeContainer(
    name="NodeContainer",
    namespace="",
    package="rclcpp_components",
    executable=LaunchConfiguration("container_executable"),
    prefix="gdbserver 127.0.0.1:3050",
    composable_node_descriptions=[
        desc1,
        desc2,
    ],
    output="screen",
)

I added prefix so that I can hook a dubugging instance to this container in the launchfile (which is nested within 4 other levels of launch-files)

Now I wish to create a launch.json in VSCode to debug, so I wrote this configuration:

  {
    "name": "NodeDebug",
    "type": "cppdbg",
    "request": "launch",
    "miDebuggerServerAddress": "127.0.0.1:3050",
    "program": <executable-here>,
    "preLaunchTask": "launch_nodes",
    "MIMode": "gdb",
    "setupCommands": [
      {
        "description": "Enable pretty-printing for gdb",
        "text": "-enable-pretty-printing",
        "ignoreFailures": true
      }
    ]
  }

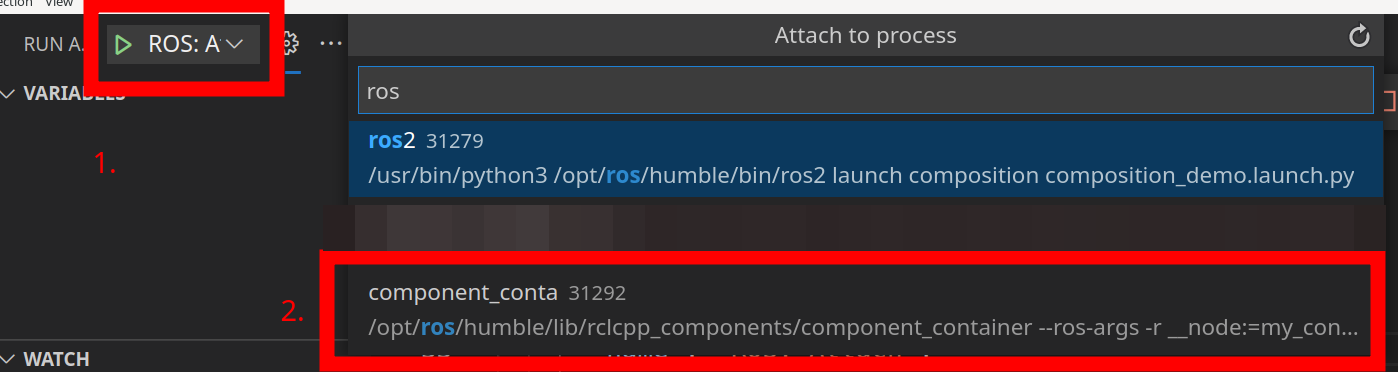
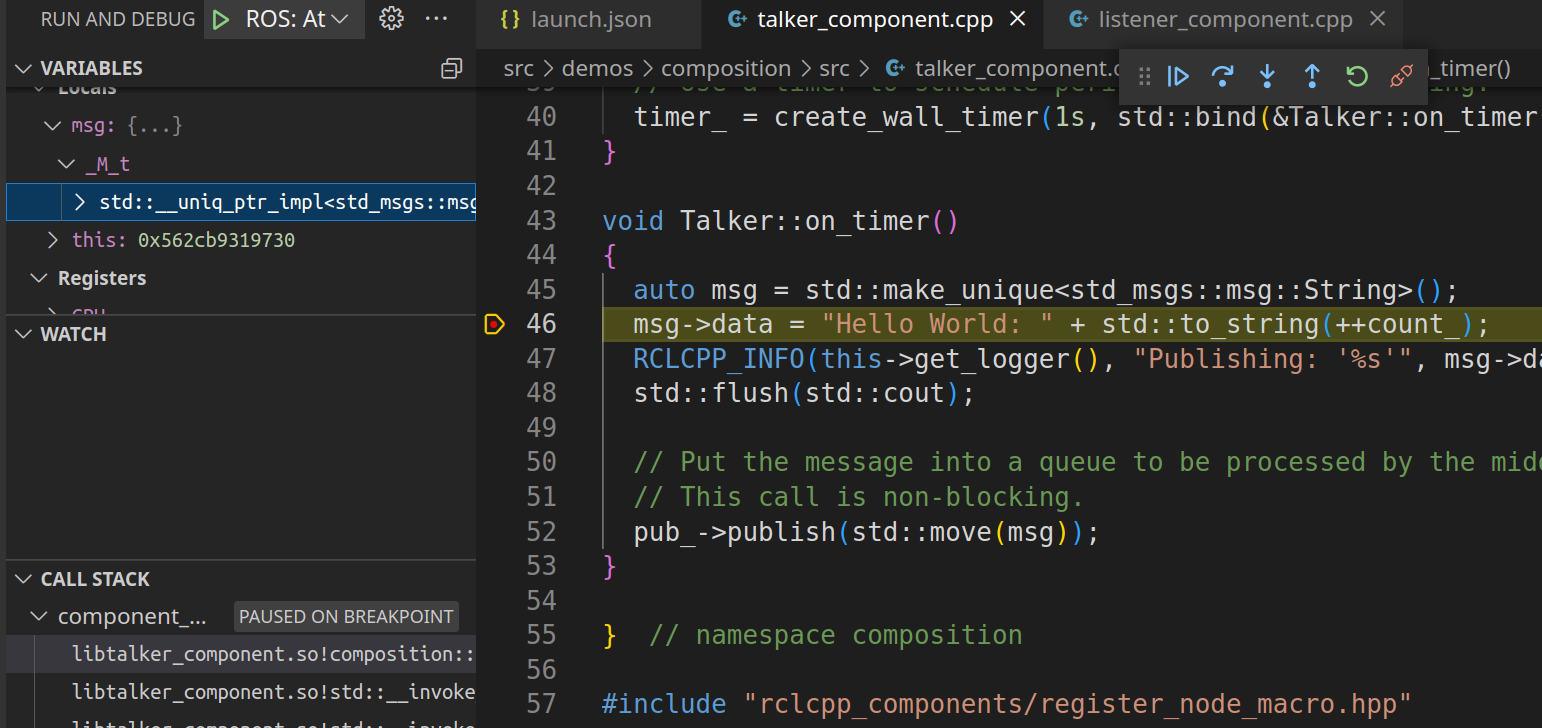
I know what to add to program: if I were debugging a single node (ie. node1_node and node2_node). However, since the executable for this container is built on runtime, how I do access it? Is there any other way to debug a ComposableNodeContainer?

edit retag flag offensive close merge delete

1 Answer

Sort by ยป oldest newest most voted
0

answered 2022-09-29 22:26:17 -0500

JustinBlack02 gravatar image

updated 2022-09-29 22:29:17 -0500

Yes it is possible, however the tricky part is selecting the correct process when you are attaching your debugger.

As an example, I can show you how I set a breakpoint in the talker node of the composition demo.

  1. Follow the instructions here. You should simply add the following to your launch.json

    { "configurations": [ { "name": "ROS: Attach", "type": "ros", "request": "attach" } ] }

  2. Launch your component container, in this case ros2 launch composition ./composition_demo.launch.py

  3. Launch the ROS: Attach debug target in vscode. Pick c++; when you get the drop down menu to choose a process, look for the one running the component container, not the launch file. As illustrated in the screenshot below. You might get a prompt asking for admin priveleges in the console during this process.

debug component container

Finally, place a breakpoint somewhere to stop the program

image description

edit flag offensive delete link more

Question Tools

2 followers

Stats

Asked: 2022-09-29 16:32:27 -0500

Seen: 372 times

Last updated: Sep 29 '22