ROS Resources: Documentation | Support | Discussion Forum | Index | Service Status | ros @ Robotics Stack Exchange
Ask Your Question
0

Visualize global coordinate points as Markers in Rviz

asked 2021-06-17 00:39:25 -0500

congphase gravatar image

updated 2021-06-17 02:09:14 -0500

Hello all,

I got a .csv file containing latitude and longitude coordinates of over 100 points. The goal is to form a LINE_STRIP from these points. Here's my code. Here's my .csv file. The general idea of the code is to append all points to a marker object of LINE_STRIP type, and publish the object in the while loop.

But it does not show anything, although using the same code idea, I can visualize simple points (x and y values of line_point are of 0.0, 1.0, 2.0 , ...).

I tried taking 2 points in the .csv file, form a LINE_STRIP marker, and publish it. But it still showed nothing.

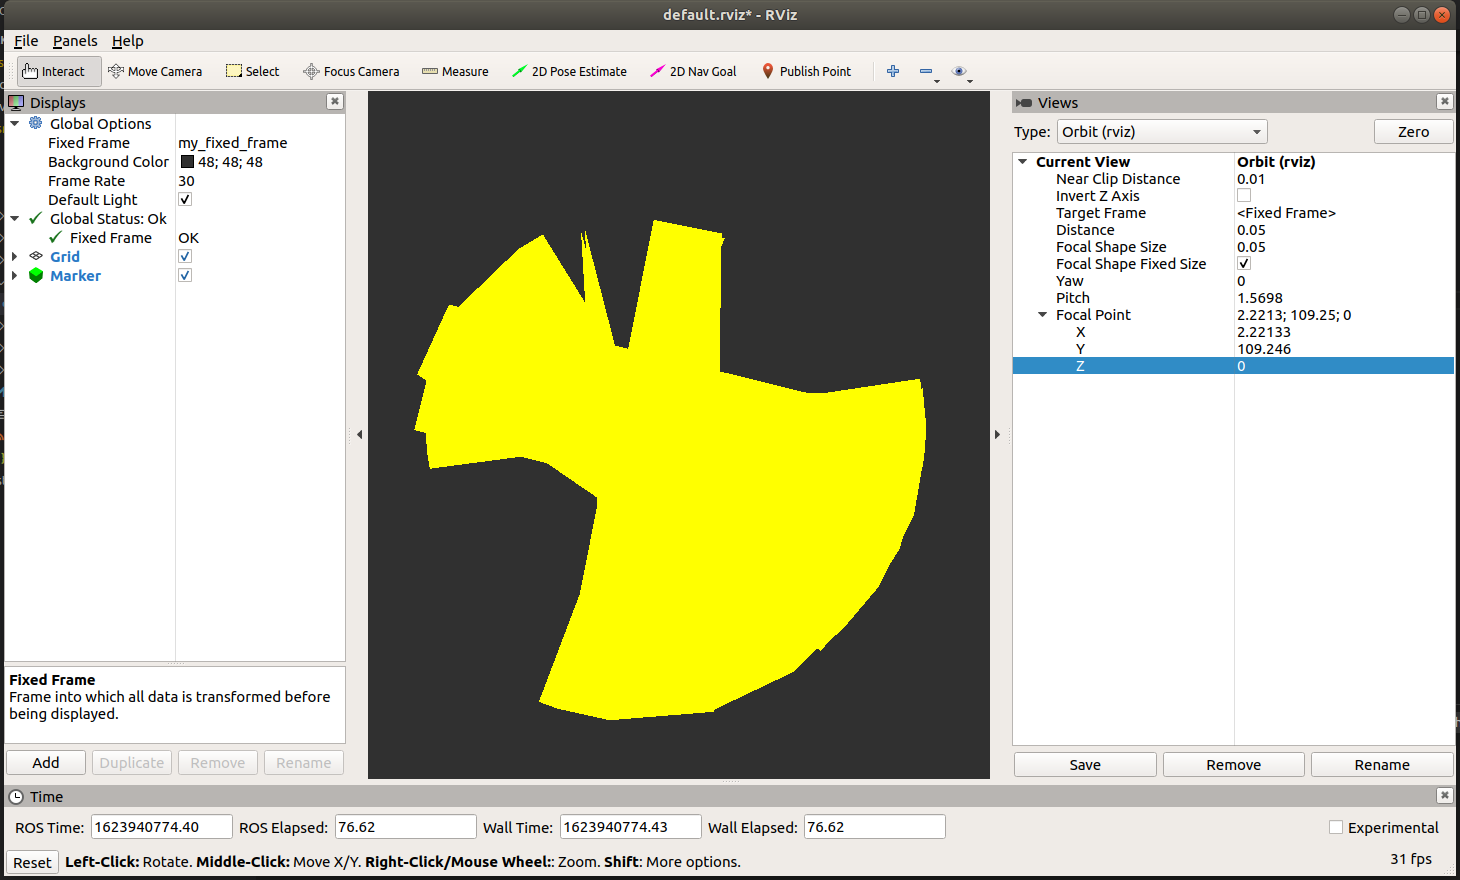
I then tried setting the x of the first point down to 1.xxxxxxxx, and keep y of the first point, x, y of the second point the same (x ~ 12.xxxxxxxx; y ~ 109.xxxxxx). And this successfully showed.

I guess there's something wrong with the current "setting", when I can't visualize global coordinates this way.

Please give some advice.

edit retag flag offensive close merge delete

1 Answer

Sort by ยป oldest newest most voted
0

answered 2021-06-17 09:54:23 -0500

djchopp gravatar image

What are you using to visualize the points? If it is RVIZ, then you need your coordinates to be in a cartesian coordinate system. Right now it is interpreting all your lat/lon points as as x/y in meters. This means it is interpreting that all your points are within a centimeter of each other.

If you set RVIZ with the following settings, you will see that it is there, just all in a very small space:

  • Fixed Frame (left panel): my_fixed_frame
  • Distance (right panel): 0.05
  • Focal Shape Size(right panel): 0.05
  • Yaw (right panel): 0
  • Pitch (right panel): 1.57
  • Focal Point (right panel): 2.221;109.246;0

image description

You need to convert from lat/lon to a cartesian coordinate system (such as UTM).

Here is one such way to do that:

Read the first point in and convert to utm. This will be the 0,0 point of my_fixed_frame. Convert all your points to utm while adding them to marker.points and subtract off the utm coordinates of the first point. This shifts the global utm coordinate of the point to a local coordinate. Publish the utm to my_fixed_frame transform. Publish the markers.

Sample code for that method:

#!/usr/bin/env python

from visualization_msgs.msg import Marker
from geometry_msgs.msg import Point
import rospy
import pandas as pd
import utm
import tf

count = 0
MARKERS_MAX = 100
csv_file = "/path/to/NT-all-points.csv"

rospy.init_node('lane_line_GT_node', anonymous=True)
pub = rospy.Publisher('lane_line_GT', Marker, queue_size=10)
df = pd.read_csv(csv_file)

tf_bcast = tf.TransformBroadcaster()

marker = Marker()
marker.header.frame_id = "my_fixed_frame"
marker.type = marker.LINE_STRIP
marker.action = marker.ADD

# marker scale
marker.scale.x = 0.03
marker.scale.y = 0.03
marker.scale.z = 0.03

# marker color
marker.color.a = 1.0
marker.color.r = 1.0
marker.color.g = 1.0
marker.color.b = 0.0

# marker orientaiton
marker.pose.orientation.x = 0.0
marker.pose.orientation.y = 0.0
marker.pose.orientation.z = 0.0
marker.pose.orientation.w = 1.0

# marker position
marker.pose.position.x = 0.0
marker.pose.position.y = 0.0
marker.pose.position.z = 0.0

# marker line points 
marker.points = []

# The first lat/lon will be our 0,0 point. Convert to utm
utm_start = utm.from_latlon(df.at[0, 'latitude'], df.at[0, 'longitude'])

for i in range(0, 127, 3):
    line_point = Point()

    # Get the UTM point of the lat/lon at index i
    utm_ne = utm.from_latlon(df.at[i, 'latitude'], df.at[i, 'longitude'])

    # Get the x,y of the i'th point relative to the start point
    line_point.x = utm_ne[0] - utm_start[0]
    line_point.y = utm_ne[1] - utm_start[1]
    line_point.z = 0

    print(f"[debug]: latitude: {line_point.x}; type: {type(line_point.x)}")
    print(f"[debug]: longitude: {line_point.y}; type: {type(line_point.y)}")

    marker.points.append(line_point)

while not rospy.is_shutdown():
    print('[debug] running ... ')

    # Continually publish the utm->my_fixed_frame transform
    tf_bcast.sendTransform(
        (utm_start[0],utm_start[1],0),
        (0,0,0,1),
        rospy.Time.now(),
        "my_fixed_frame", # child
        "utm")  # parent

    # Publish the Marker ...
(more)
edit flag offensive delete link more

Comments

Thank you very much for such detailed help.

I tried your code, it showed a straight line. While the data in the .csv should have something like this.

Everything in the code seems sensible, except this straight line. Do you get the same result?

congphase gravatar image congphase  ( 2021-06-17 21:36:26 -0500 )edit

You have roughly a 100 meters of straight lines for your first 14 points. I think this is what you are seeing. Try zooming out in rviz and orient to a top down view. Because your path is long, you should increase your marker scale so you can see the whole path when zoomed out. I used marker.scale.x = 1.0

Note: Your points do not form a continuous path. There are large jumps between index 14-15, 15-16, 16-17, among others which will cause the visualization to have long straight lines to connect the discontinuities.

Also the last 2 points are not close to your path.

djchopp gravatar image djchopp  ( 2021-06-18 09:18:21 -0500 )edit

Thank you a lot @djchopp, Sorry for the late response. I'll try again and update the result here.

congphase gravatar image congphase  ( 2021-06-19 23:41:22 -0500 )edit

Question Tools

2 followers

Stats

Asked: 2021-06-17 00:39:25 -0500

Seen: 1,320 times

Last updated: Jun 17 '21