
How to subscribe to map and markers and display on web GUI using roslibjs?
I am looking to display a map of type nav_msgs/OccupancyGrid on a web GUI with markers overlaid on it using tools like roslibjs, ros2djs or ros3djs and vue on noetic.
Inspired by the example here, I have created an index.html and main.js file in an attempt to subscribe to my /map topic and display that in the web GUI as it grows.
index.html:
<!DOCTYPE html>
<html lang="en-GB">

<head>
    <meta charset="UTF-8">
    <meta name="viewport" content="width=device-width, initial-scale=1, shrink-to-fit=no">
    <script type="text/javascript" src="https://cdn.jsdelivr.net/npm/vue@2.6.11"></script>
    <script type="text/javascript" src="https://static.robotwebtools.org/EaselJS/current/easeljs.js"></script>
    <script type="text/javascript" src="https://static.robotwebtools.org/EventEmitter2/current/eventemitter2.js"></script>
    <script type="text/javascript" src="https://static.robotwebtools.org/roslibjs/current/roslib.js"></script>
    <script type="text/javascript" src="https://static.robotwebtools.org/ros2djs/current/ros2d.js"></script>
</head>

<body>
    <main id="vueApp">
        <button class="mt-2 btn btn-danger btn-lg my-auto" v-if="connected === false" @click="init" style="width: 100%;">Connect GUI To Robot</button>
        <div id="map"></div>
        <script type="text/javascript" src="main.js"></script>
    </main>
</body>

</html>
main.js:
new Vue({
    el: '#vueApp',

    data: {
        ros: null,
        connected: false,
        pubInterval: null,
        mapGridClient: null,
        mapViewer: null,
    },

    methods: {

        init: function () {

            // ROSBridge Connection Object
            this.ros = new ROSLIB.Ros({
                url: 'ws://' + window.location.hostname + ':9090'
            })

            // ROSBridge Connection Object Callbacks
            this.ros.on('connection', () => {
                this.connected = true
                console.log('Connection to ROSBridge established')
                this.pubInterval = setInterval(this.publish, 100)
            })
            this.ros.on('error', (error) => {
                console.log('Something went wrong when trying to connect')
                console.log(error)
            })
            this.ros.on('close', () => {
                this.connected = false
                console.log('Connection to ROSBridge was closed')
                clearInterval(this.pubInterval)
            })

            // Map Viewer
            this.mapViewer = new ROS2D.Viewer({
                divID : 'map',
                width : 400,
                height : 400
            })
            this.mapGridClient = new ROS2D.OccupancyGridClient({
                ros : this.ros,
                rootObject : this.mapViewer.scene,
                continuous : true
            })
            this.mapGridClient.on('change', function(){
                this.mapViewer.scaleToDimensions(this.mapGridClient.currentGrid.width, this.mapGridClient.currentGrid.height);
            })

        }
    }
})
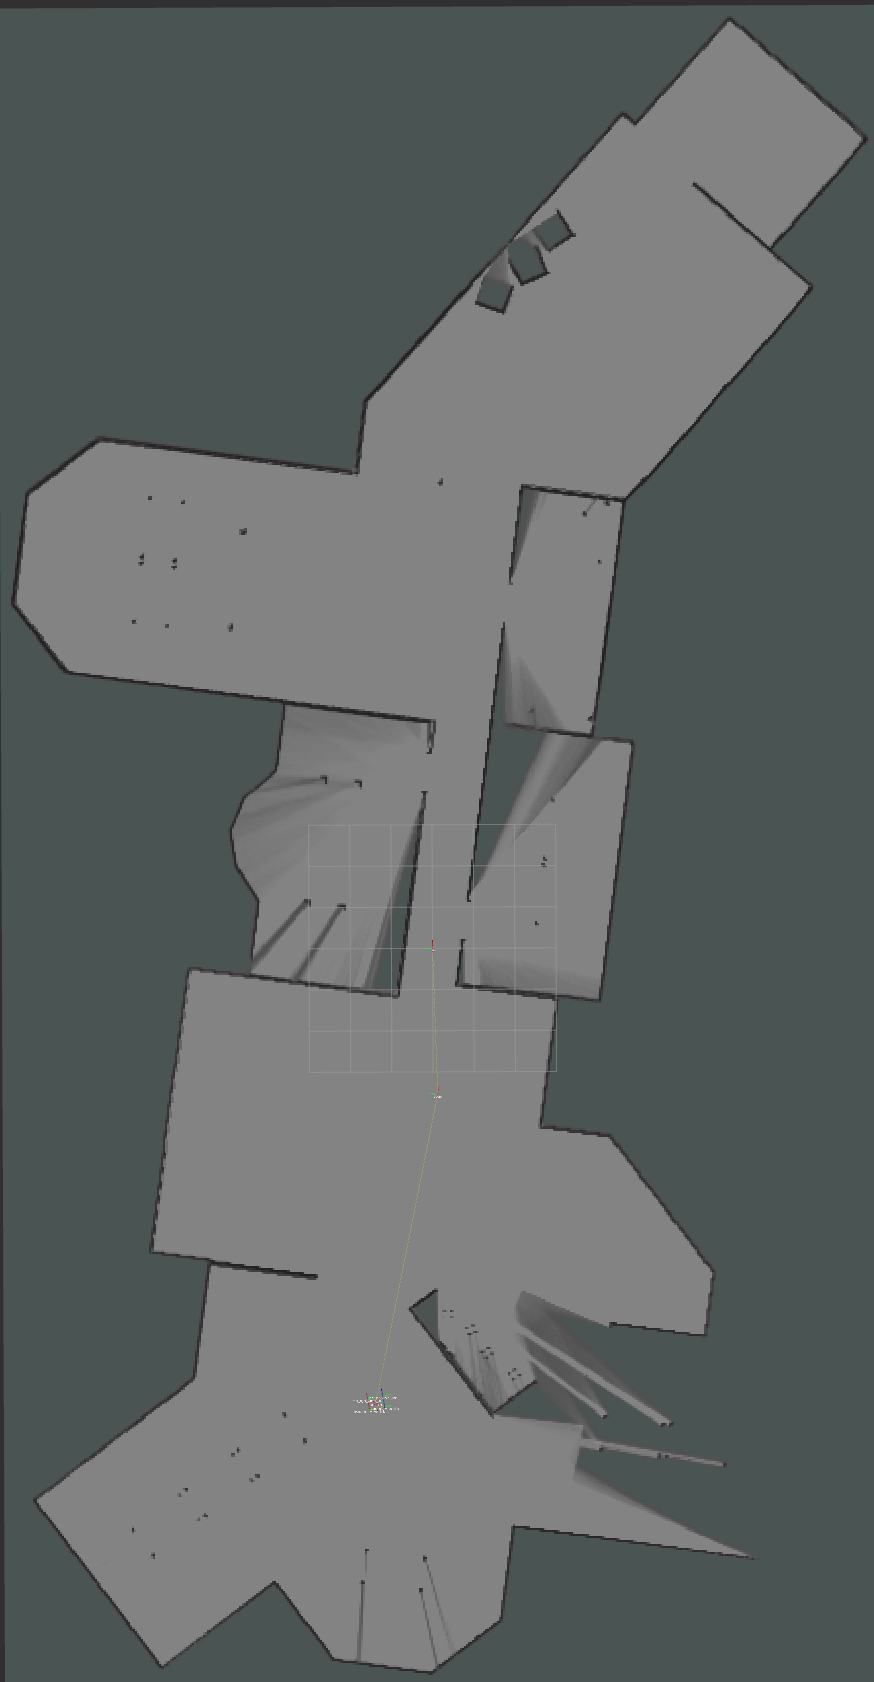
This seems to be subscribing to the map and displaying it but only a small fraction of it appears as expected. See below for a comparison between the map viewed in RViz and the map view on the web GUI.

Also, I need to work out how to subscribe to my /visualization_marker topic of type visualization_msgs/Markeroverlay and display these markers as they become available on top of the map.
Any ideas how to solve these issues?

Same issue here . Were you able to find a solution ?