
Axis direction using Rviz
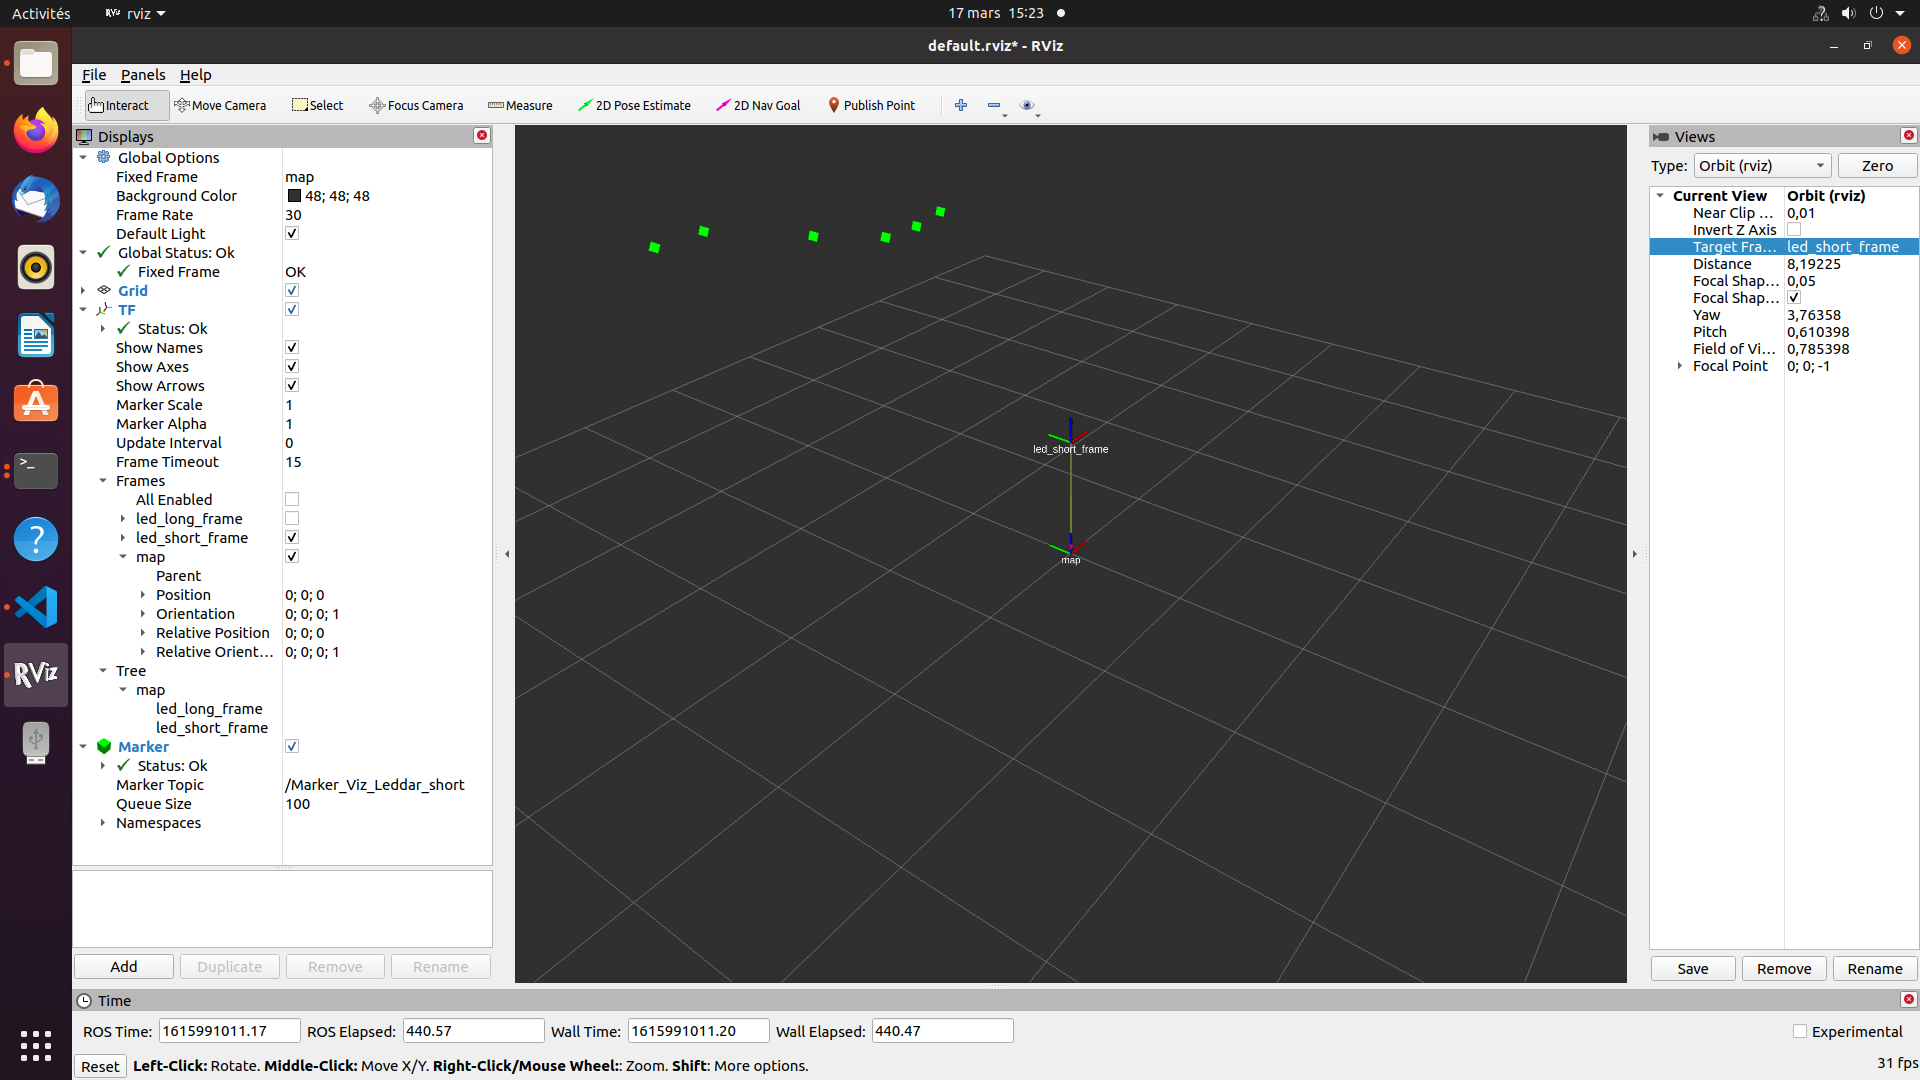
Hello all, I am using the ROS Noetic and rviz to visualize lidar data. So, I am using tow frame:s the map frame , and a moving frame which is the lidar frame(led_short_frame) . I am using visualization_msgs::Marker PointsViz to visualize the lidar points. The problem is that I can't get the x axis for the point p.x and y axis for p.y data, i.e, it is reversed during visualization (the image below). The code is as follows:
#include <ros/ros.h>
#include <can_msgs/Frame.h>
#include <sensor_msgs/LaserScan.h>
#include <string>
#include <iostream>
#include <boost/array.hpp>
#include <boost/endian/conversion.hpp>
#include <leddar/leddar.h>
#include <leddar/leddar_xy.h>
#include <math.h>
#include <visualization_msgs/Marker.h>

 ros::Publisher chatter_pub;
ros::Publisher marker_pub;
bool data_ready_to_send = false;
int Count_nb_detections=0;
 #define PI 3.14159265
bool First_run=true;
int angle_segment[8]={69,75,81,87,93,99,105,111};
leddar::leddar_xy *leddar_xy_message_out;

void canFrameToXYCallback(const leddar::leddar::ConstPtr& msg_leddar)
{
     leddar_xy_message_out = new leddar::leddar_xy();
    visualization_msgs::Marker PointsViz;

    int new_nb_detections=0;
     float Cord_x=0.f,Cord_y =0.f;
     PointsViz.pose.orientation.w=1.0;
     PointsViz.header.frame_id="led_short_frame";
     PointsViz.header.stamp=ros::Time::now();
     PointsViz.color.g=1.0f;
     PointsViz.color.a=1.0f;
     PointsViz.scale.x=0.1;
     PointsViz.scale.y=0.1;
     PointsViz.pose.orientation.w=1.0;
     geometry_msgs::Point p;
     PointsViz.ns="points_and_lines";
     PointsViz.type=visualization_msgs::Marker::POINTS;
    for (unsigned int i =0 ;i< (msg_leddar->nb_detections);i++)

     {


         if(msg_leddar->Distance[i]<60000)
    {
        if(msg_leddar->Flag[i]==1 || msg_leddar->Flag[i]==9 )
        {       new_nb_detections++;


                 leddar_xy_message_out->Distance.push_back(msg_leddar->Distance[i]);

                 leddar_xy_message_out->Flag.push_back(msg_leddar->Flag[i]);

                 leddar_xy_message_out->Magnitude.push_back(msg_leddar->Magnitude[i]);
                 leddar_xy_message_out->Segment.push_back(msg_leddar->Segment[i]);

                 Cord_x= 0.01f * msg_leddar->Distance[i] * cos(angle_segment[msg_leddar->Segment[i]]*PI/180)+0.082f ;
                 Cord_y= 0.01f * msg_leddar->Distance[i] * sin(angle_segment[msg_leddar->Segment[i]]*PI/180)+1.9f;

                 leddar_xy_message_out->Pos_x.push_back(Cord_x)  ;
                 leddar_xy_message_out->Pos_y.push_back(Cord_y)   ;
                p.x= Cord_x;
                p.y= Cord_y;
                 PointsViz.points.push_back(p);


        }

    }

     }

                leddar_xy_message_out -> nb_detections= new_nb_detections;


              if( new_nb_detections!=0)
              {
                marker_pub.publish(PointsViz);
                chatter_pub.publish(*leddar_xy_message_out);
               }
}
int main(int argc, char *argv[])
{
  ros::init(argc, argv, "leddar_RawToXY_node");

  ros::NodeHandle n;

  chatter_pub = n.advertise<leddar::leddar_xy>("leddar_raw_to_XY", 100);
  marker_pub =  n.advertise<visualization_msgs::Marker> ("Marker_Viz_Leddar", 100);

  ros::Subscriber sub2 = n.subscribe("leddar_raw_data", 100, canFrameToXYCallback);

  ROS_INFO("receive_can_leddar_XY_48 ready - waiting for data ... ");

  ros::spin();

  return 0;
}
The tf is defined in the roslaunch file is:
<node pkg="tf" type="static_transform_publisher" name="transf_leddar_map" args="0 0 1 0 0 0 1 /map /led_short_frame 100" />
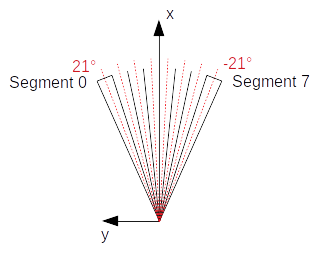
The FOV of the sensor is as following:
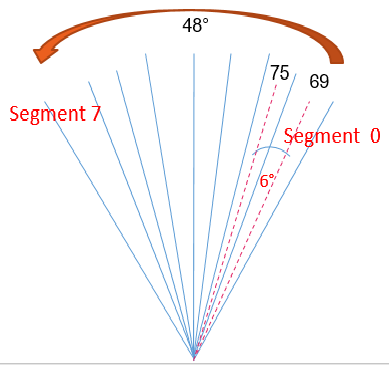
Please, how I can get the same direction of the axis, between the point p and the used fame (p.x according to x axis and p.y according to y axis)?
 Thank you

Is
led_long_frameyour fixed frame in RViz?no,it is a frame sensor and it moves
Ok, what is your fixed frame in RViz? Please, post the rest of your code for context.
Hello, it is the map frame. The problem is that when I plotted the geometry_msgs/Point.msg (p.x & p.y)), it is reversed during visualization and it does not respect the Lidar frame (arbitrary direction). Thank you.
I suspect you're plotting the point in the
mapframe rather than the lidar frame. Would that match the orientation of the map frame in the picture above? If not that, it may be some other frame-related mismatch.I added the below figure for more details
Please, edit your question with new information rather than posting an answer. It's not clear to me how the second image relates to the first as none of the frames or points appear to be the same. Can you post your full code?
Ok, I edited the question and I updated it