
nodelet load process does message (de)serialization?

I've just run a profiler on my nodelets and I've found out an interesting thing. It seems that message (de)serialization is done by the processes launched by nodelet load, and not in the manager. Is that right? How could it then pass pointers around to the nodelet manager? It also seems that there is some serialization effort even though the nodelet doesn't publish anything consumed outside the manager.
The nodelet subscribes to slow pointclouds (0.3 Hz, about 1M points) and publishes similar ones (it is based on pcl_ros nodelets). Each nodelet load process is taking about 10% of one core (mobile i7) to just deserialize and serialize the data. That seems quite a lot given the size and frequency of the pointcloud. The only other subscribed topic is /tf (which I subsampled for these nodelets so that it isn't anything big). Am I doing something wrong? The publisher is publishing sensor_msgs::PointCloud2Ptr and the subscriber's argument type is const sensor_msgs::PointCloud2ConstPtr&. All nodes participating in this are compiled in release mode.
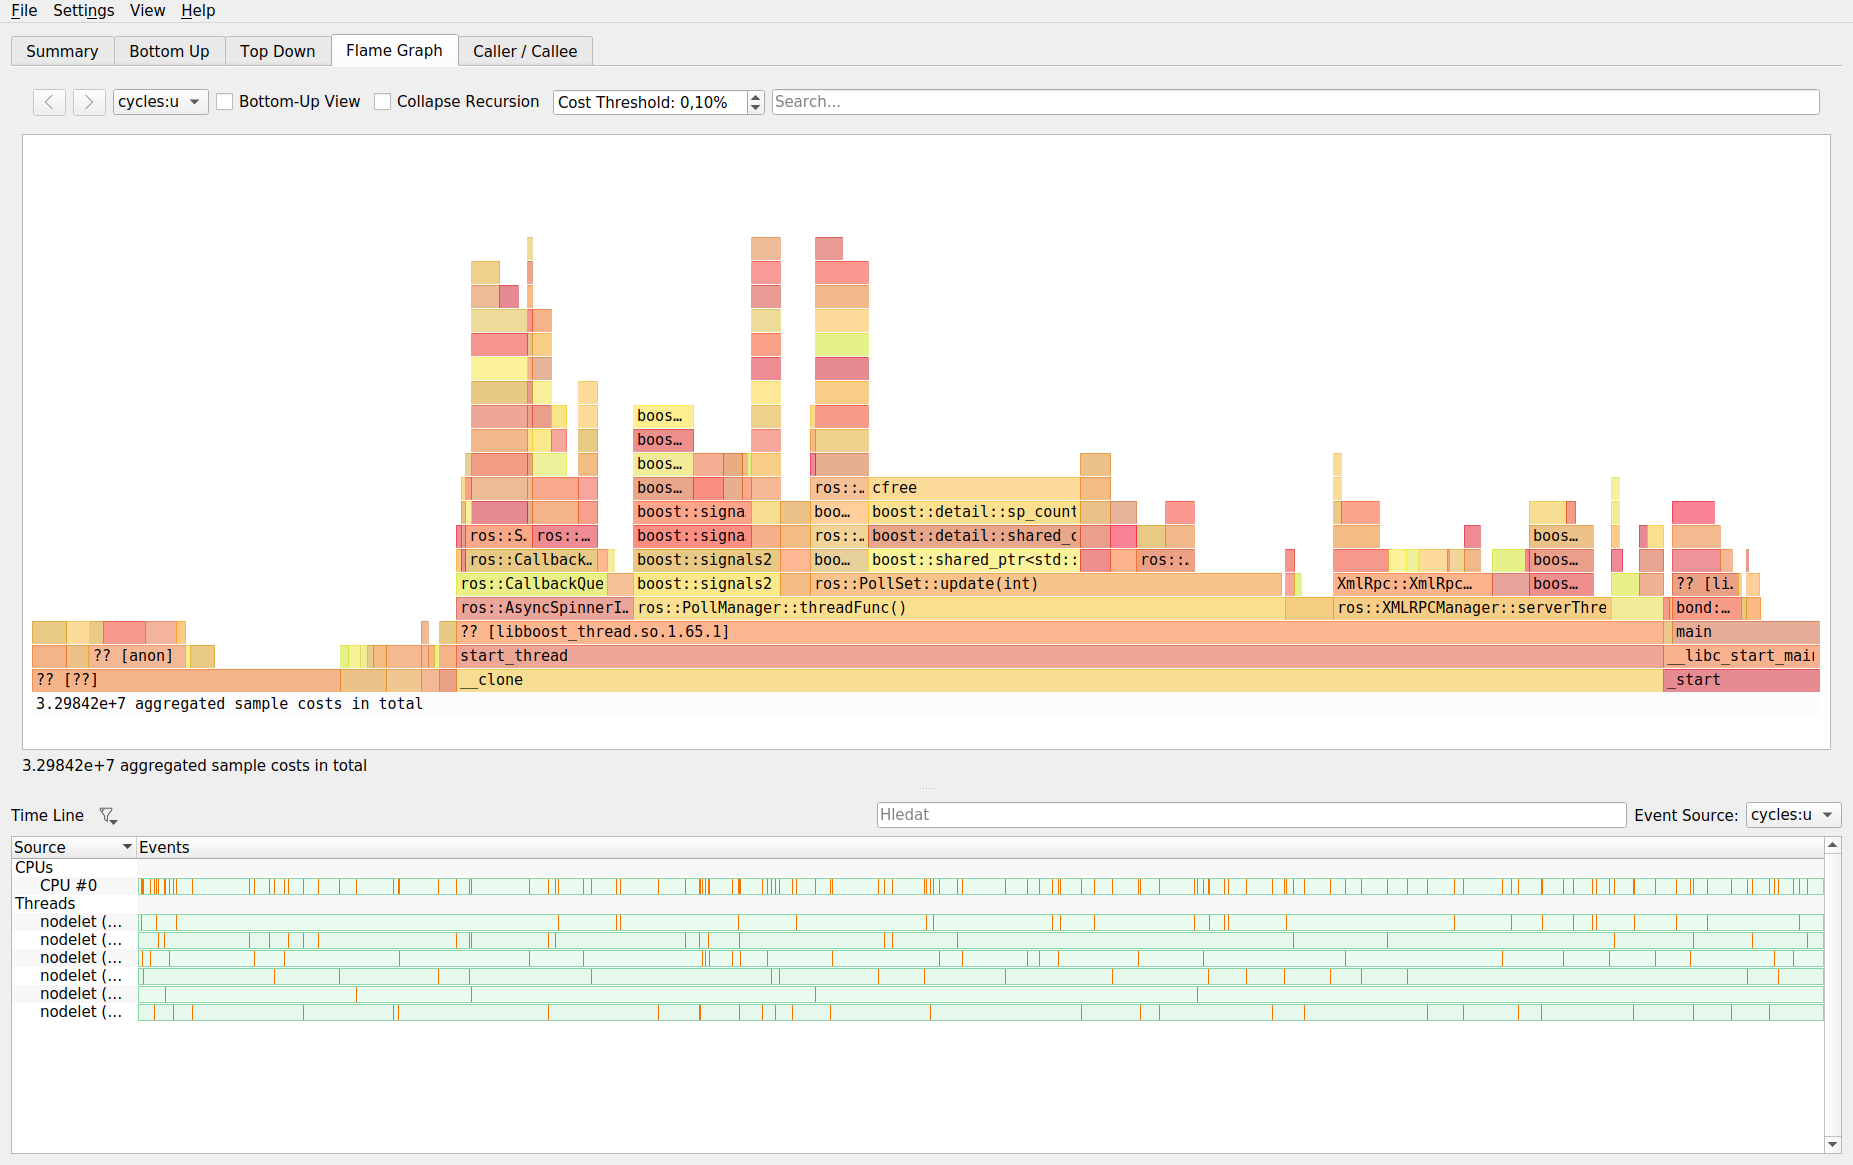
A profiler view of the nodelet manager shows just the "effective work", i.e. pointcloud transformation. Here's a view from the profiler of the nodelet load process (it isn't perfect, but you should be able to decode the big parts dedicated to (de)serialization).
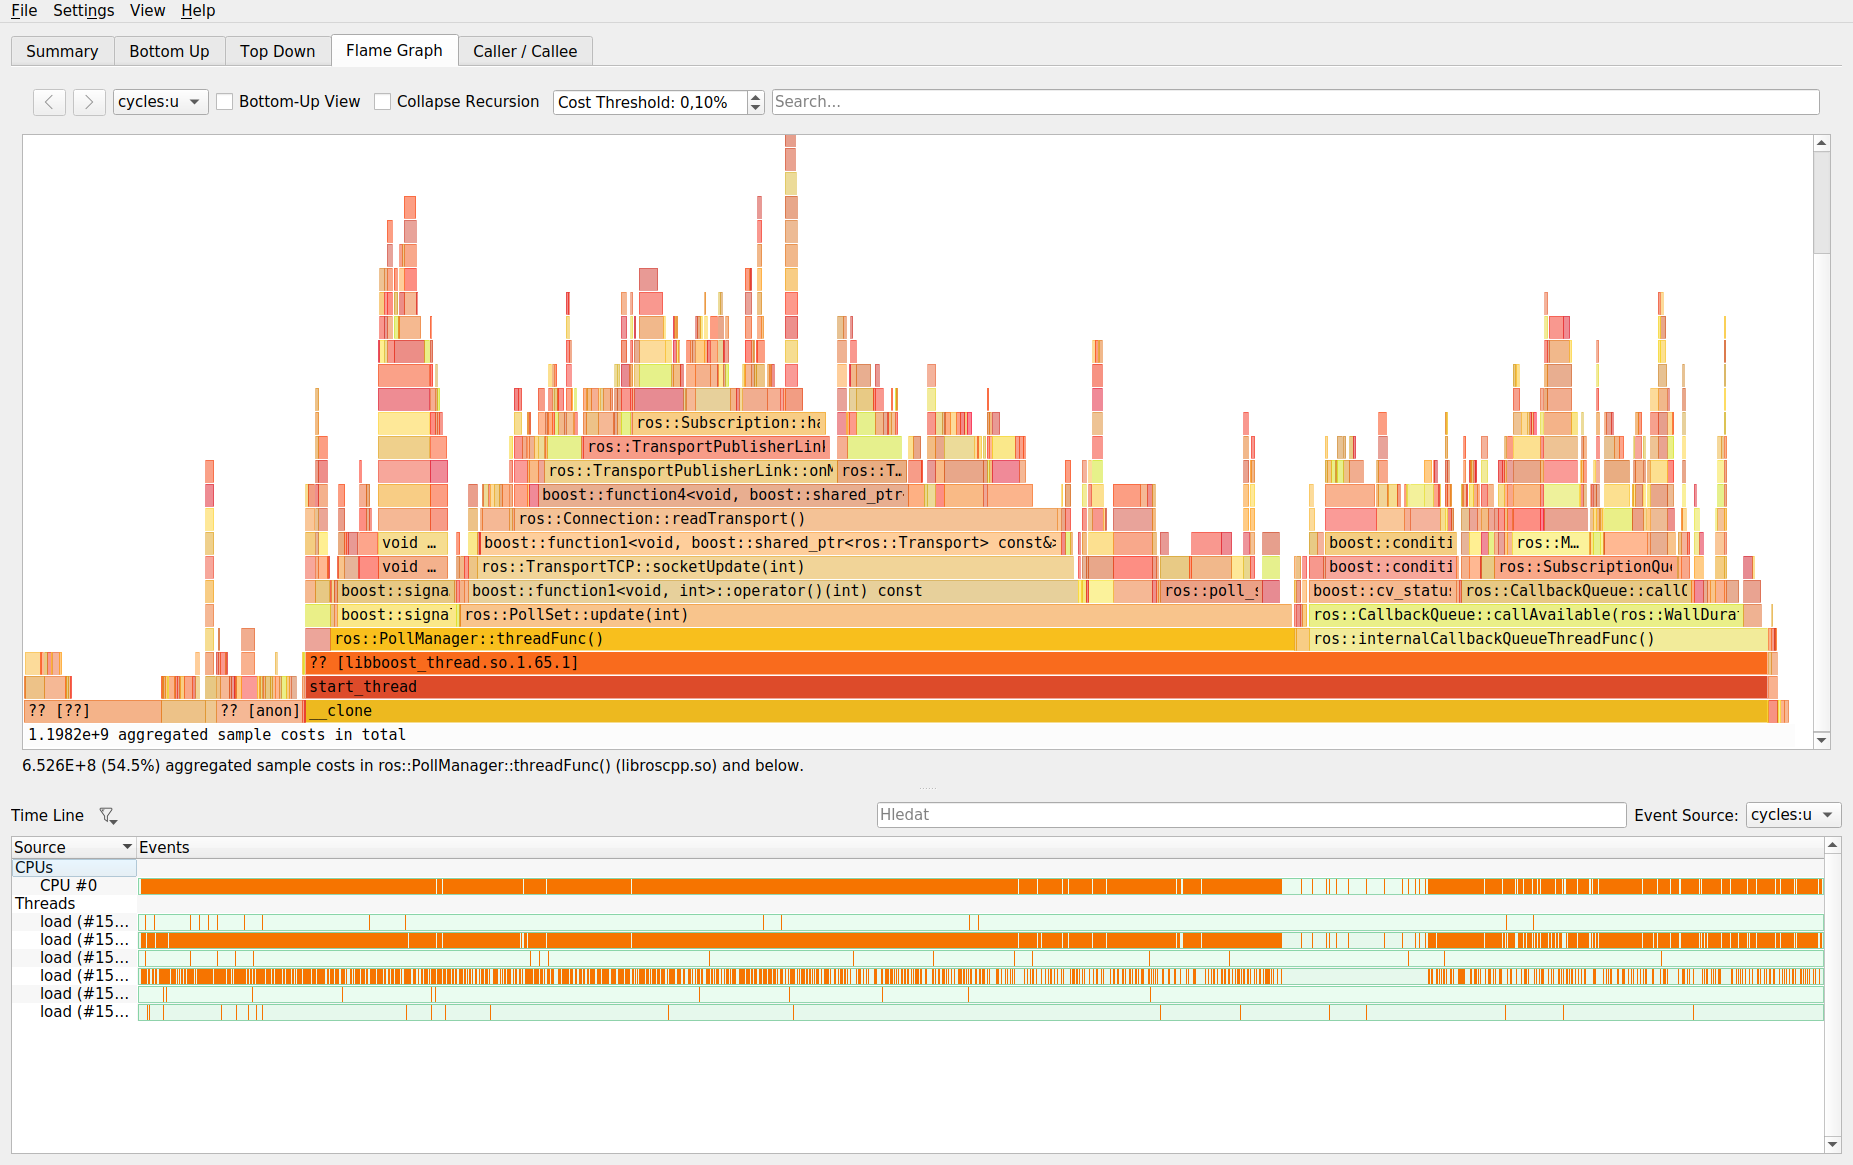
Not to future self and others: the perf data can be recorded with perf record --freq=997 --call-graph dwarf -q -o /tmp/perf -p $PID_OF_THE_PROCESS. I used Hotspot to view the perf file.

This confuses me:
nodelet loaddoes not start any processes, unless you are referring to thenodeletbinary which calls a few services to load the shared library and start the nodelet.Additionally: could you clarify where in your flamegraph you are seeing (de)serialisation happen?
if you're doing things right, that would not be possible.
Again:
nodelet loadwill only call a few services and then exit. Unless you are starting a manager or invoking it withstandalone.Please show the commands your using to start things.
@gvdhoorn: As you can read in my answer, I've found that the culprit is the
/clocktopic. However, I have to correct you - it is not true that thenodelet loadnode exits when it finishes launching the node. It actually sits there (on aros::spin()call) and waits for either broken bond or sigint, in which case it tries to call unload_nodelet on the manager before exit.