ROS Resources: Documentation | Support | Discussion Forum | Index | Service Status | ros @ Robotics Stack Exchange
Ask Your Question
0

rqt_graph not showing all active nodes

asked 2019-06-10 16:17:03 -0500

morten_nissov gravatar image

updated 2019-06-11 06:15:44 -0500

I've been following through the simple examples for actions and I'm not sure how to change the setting to get rqt_graph to show nodes a level "deeper".

The action is questions is an exact copy of the ones used in: link

The action node graph they get is: image description

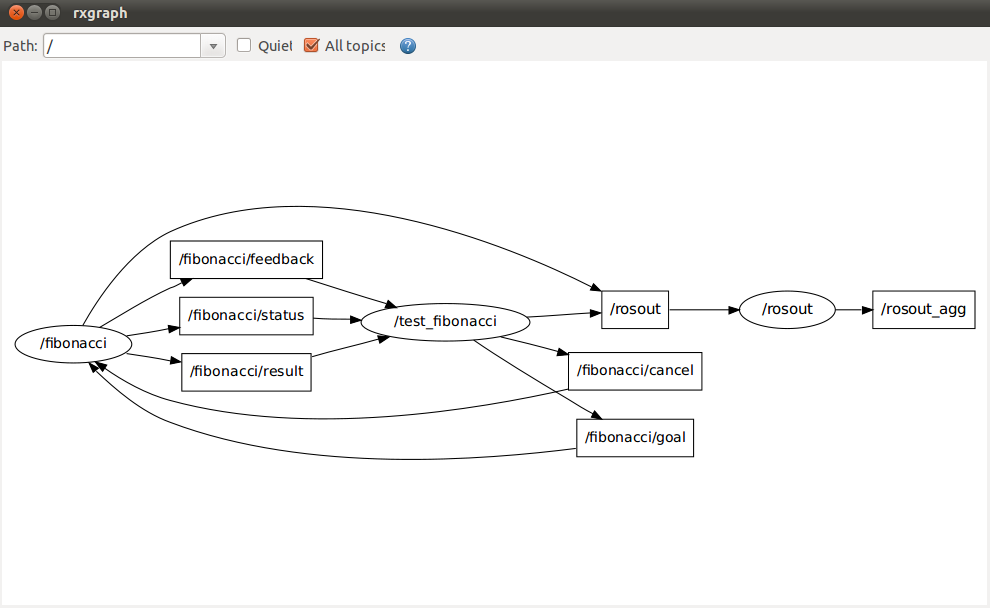
The graph I get instead is: image description

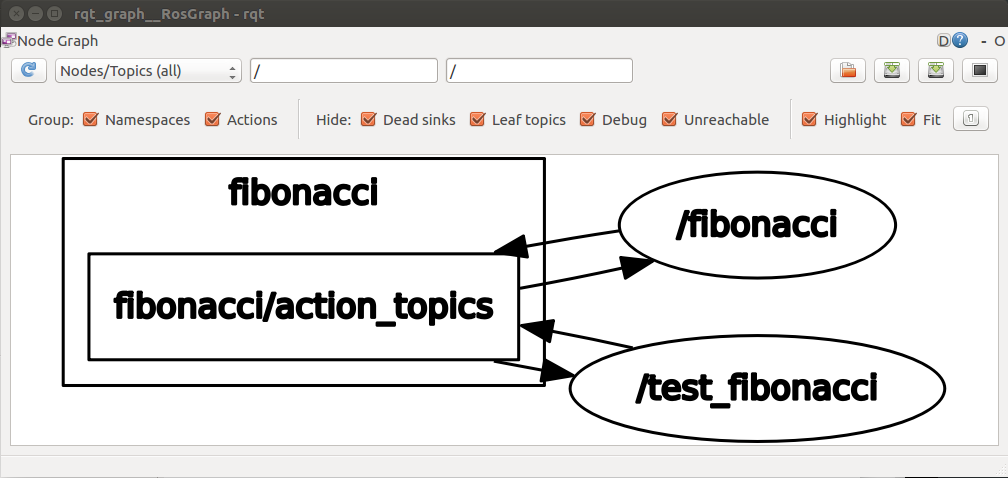
and calling rostopic list -v returns:

morten@mortenThinkPad:~$ rostopic list

/fibonacci/cancel /fibonacci/feedback /fibonacci/goal /fibonacci/result /fibonacci/status /rosout /rosout_agg

I'm relatively new to ROS so I'm not quite sure what other information could be relevant. I'm running ubuntu 16.04LTS with ROS kinetic.

edit: adding picture now that I have enough karma

edit retag flag offensive close merge delete

Comments

I would like to upload a picutre but I don't have enough karma.

you do now.

Please attach the image directly to the question.

gvdhoorn gravatar image gvdhoorn  ( 2019-06-11 03:00:32 -0500 )edit

Thanks for the reminder, I've just done so.

morten_nissov gravatar image morten_nissov  ( 2019-06-11 06:10:21 -0500 )edit

1 Answer

Sort by ยป oldest newest most voted
2

answered 2019-06-10 23:00:08 -0500

M@t gravatar image

What you are seeing is the ROS nodes. They are shown in bubbles whereas the ROS topics are shown in rectangles. If you want to see both you need to select the drop-down menu from the top-left corner and change it from "Nodes only" to "Nodes/Topics (all)"

edit flag offensive delete link more

Comments

After selecting the "nodes/topics (all)" topic the graph doesn't change. Do I need to reload the image.

morten_nissov gravatar image morten_nissov  ( 2019-06-11 01:55:36 -0500 )edit

Possibly yes - click the circular blue arrow in the top-left corner to reload the graph. If that doesn't work, add a screen shot to your question (as gvdhoorn suggested) and add the output of rostopic list.

M@t gravatar image M@t  ( 2019-06-11 04:04:38 -0500 )edit

The formatting got a little weird but I've added the output from rostopic list as well.

morten_nissov gravatar image morten_nissov  ( 2019-06-11 06:16:10 -0500 )edit

@morten_nissov: you have "group namespaces" and "group actions" enabled. That is why your graph looks different from the one shown in the tutorial.

gvdhoorn gravatar image gvdhoorn  ( 2019-06-11 06:23:43 -0500 )edit

Ah okay, I'll try again without then.

morten_nissov gravatar image morten_nissov  ( 2019-06-11 06:24:32 -0500 )edit

You'll also want to uncheck all the options in the Hide section.

gvdhoorn gravatar image gvdhoorn  ( 2019-06-11 06:30:06 -0500 )edit

Question Tools

1 follower

Stats

Asked: 2019-06-10 16:13:57 -0500

Seen: 2,764 times

Last updated: Jun 11 '19