ROS Resources: Documentation | Support | Discussion Forum | Index | Service Status | ros @ Robotics Stack Exchange
Ask Your Question
0

Rviz odometry color circles with different sizes - what do they represent

asked 2019-01-30 16:40:52 -0500

Avner gravatar image

I process a bag file with rtabmap and rgbd odometry.

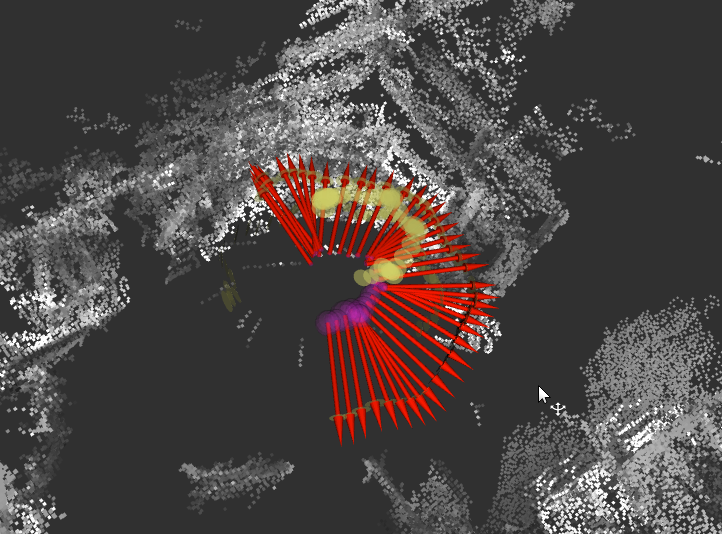
The odometry (/rtabmap/odom) in rviz shows colored (purple and yellow) dots in different sizes.

Can someone tell me what they mean?

The closest I got was in this video, but the yellow circles there refer to something else, I think.

Thanks, Avner

image description

edit retag flag offensive close merge delete

1 Answer

Sort by ยป oldest newest most voted
1

answered 2019-01-30 17:50:40 -0500

These appear to be PoseWithCovariance messages being displayed in arrow mode. They will probably make more sense if you set them to be displayed as axes using the drop down in RVIZ.

The yellow blobs you can see are actually ellipses and they describe the angular uncertainty of the pose estimate while the purple ellipsoid in the centre describes the position uncertainty of the pose estimate.

Hope this helps.

edit flag offensive delete link more

Comments

1

Link to (one of the) package(s) that provides such a plugin: rviz_plugin_covariance.

Apparently part of RViz since ros-visualization/rviz#1099.

gvdhoorn gravatar image gvdhoorn  ( 2019-01-31 02:48:24 -0500 )edit

Question Tools

1 follower

Stats

Asked: 2019-01-30 16:40:52 -0500

Seen: 595 times

Last updated: Jan 30 '19