
ros2 megapixel image pub/sub cpu usage is very high

When I try to publish and subscribe to rgb8 Images of around 1000x1000 at 20 Hz (or even 1 Hz) the cpu usage seems very high. (TODO make an apples-apples comparison with lower resolution images- maybe 4x the update rate at 1/4 the pixels?)
ROS1 vs. ROS2
(update)
I've made identical nodes in ros1 and ros2 that do nothing but publish images out and subscribe to them, the publishers look equivalent in cpu usage but the ros2 subscriber is 3 times as much cpu as ros1: 9% cpu for 1024x1024x20Hz vs. 3% in ros1.
https://github.com/lucasw/ros2_cpp_py...
The ros1 code is in the ros1 branch of https://github.com/lucasw/ros2_cpp_py
ros2 launch ros2_cpp_py pub_sub_launch.py frame_rate:=20
and
roslaunch ros2_cpp_py pub_sub.launch frame_rate:=20
Testing with more frame rates it's looking like there is just a nearly constant extra overhead, it doesn't scale with higher framerates. (TODO what about higher resolution?)
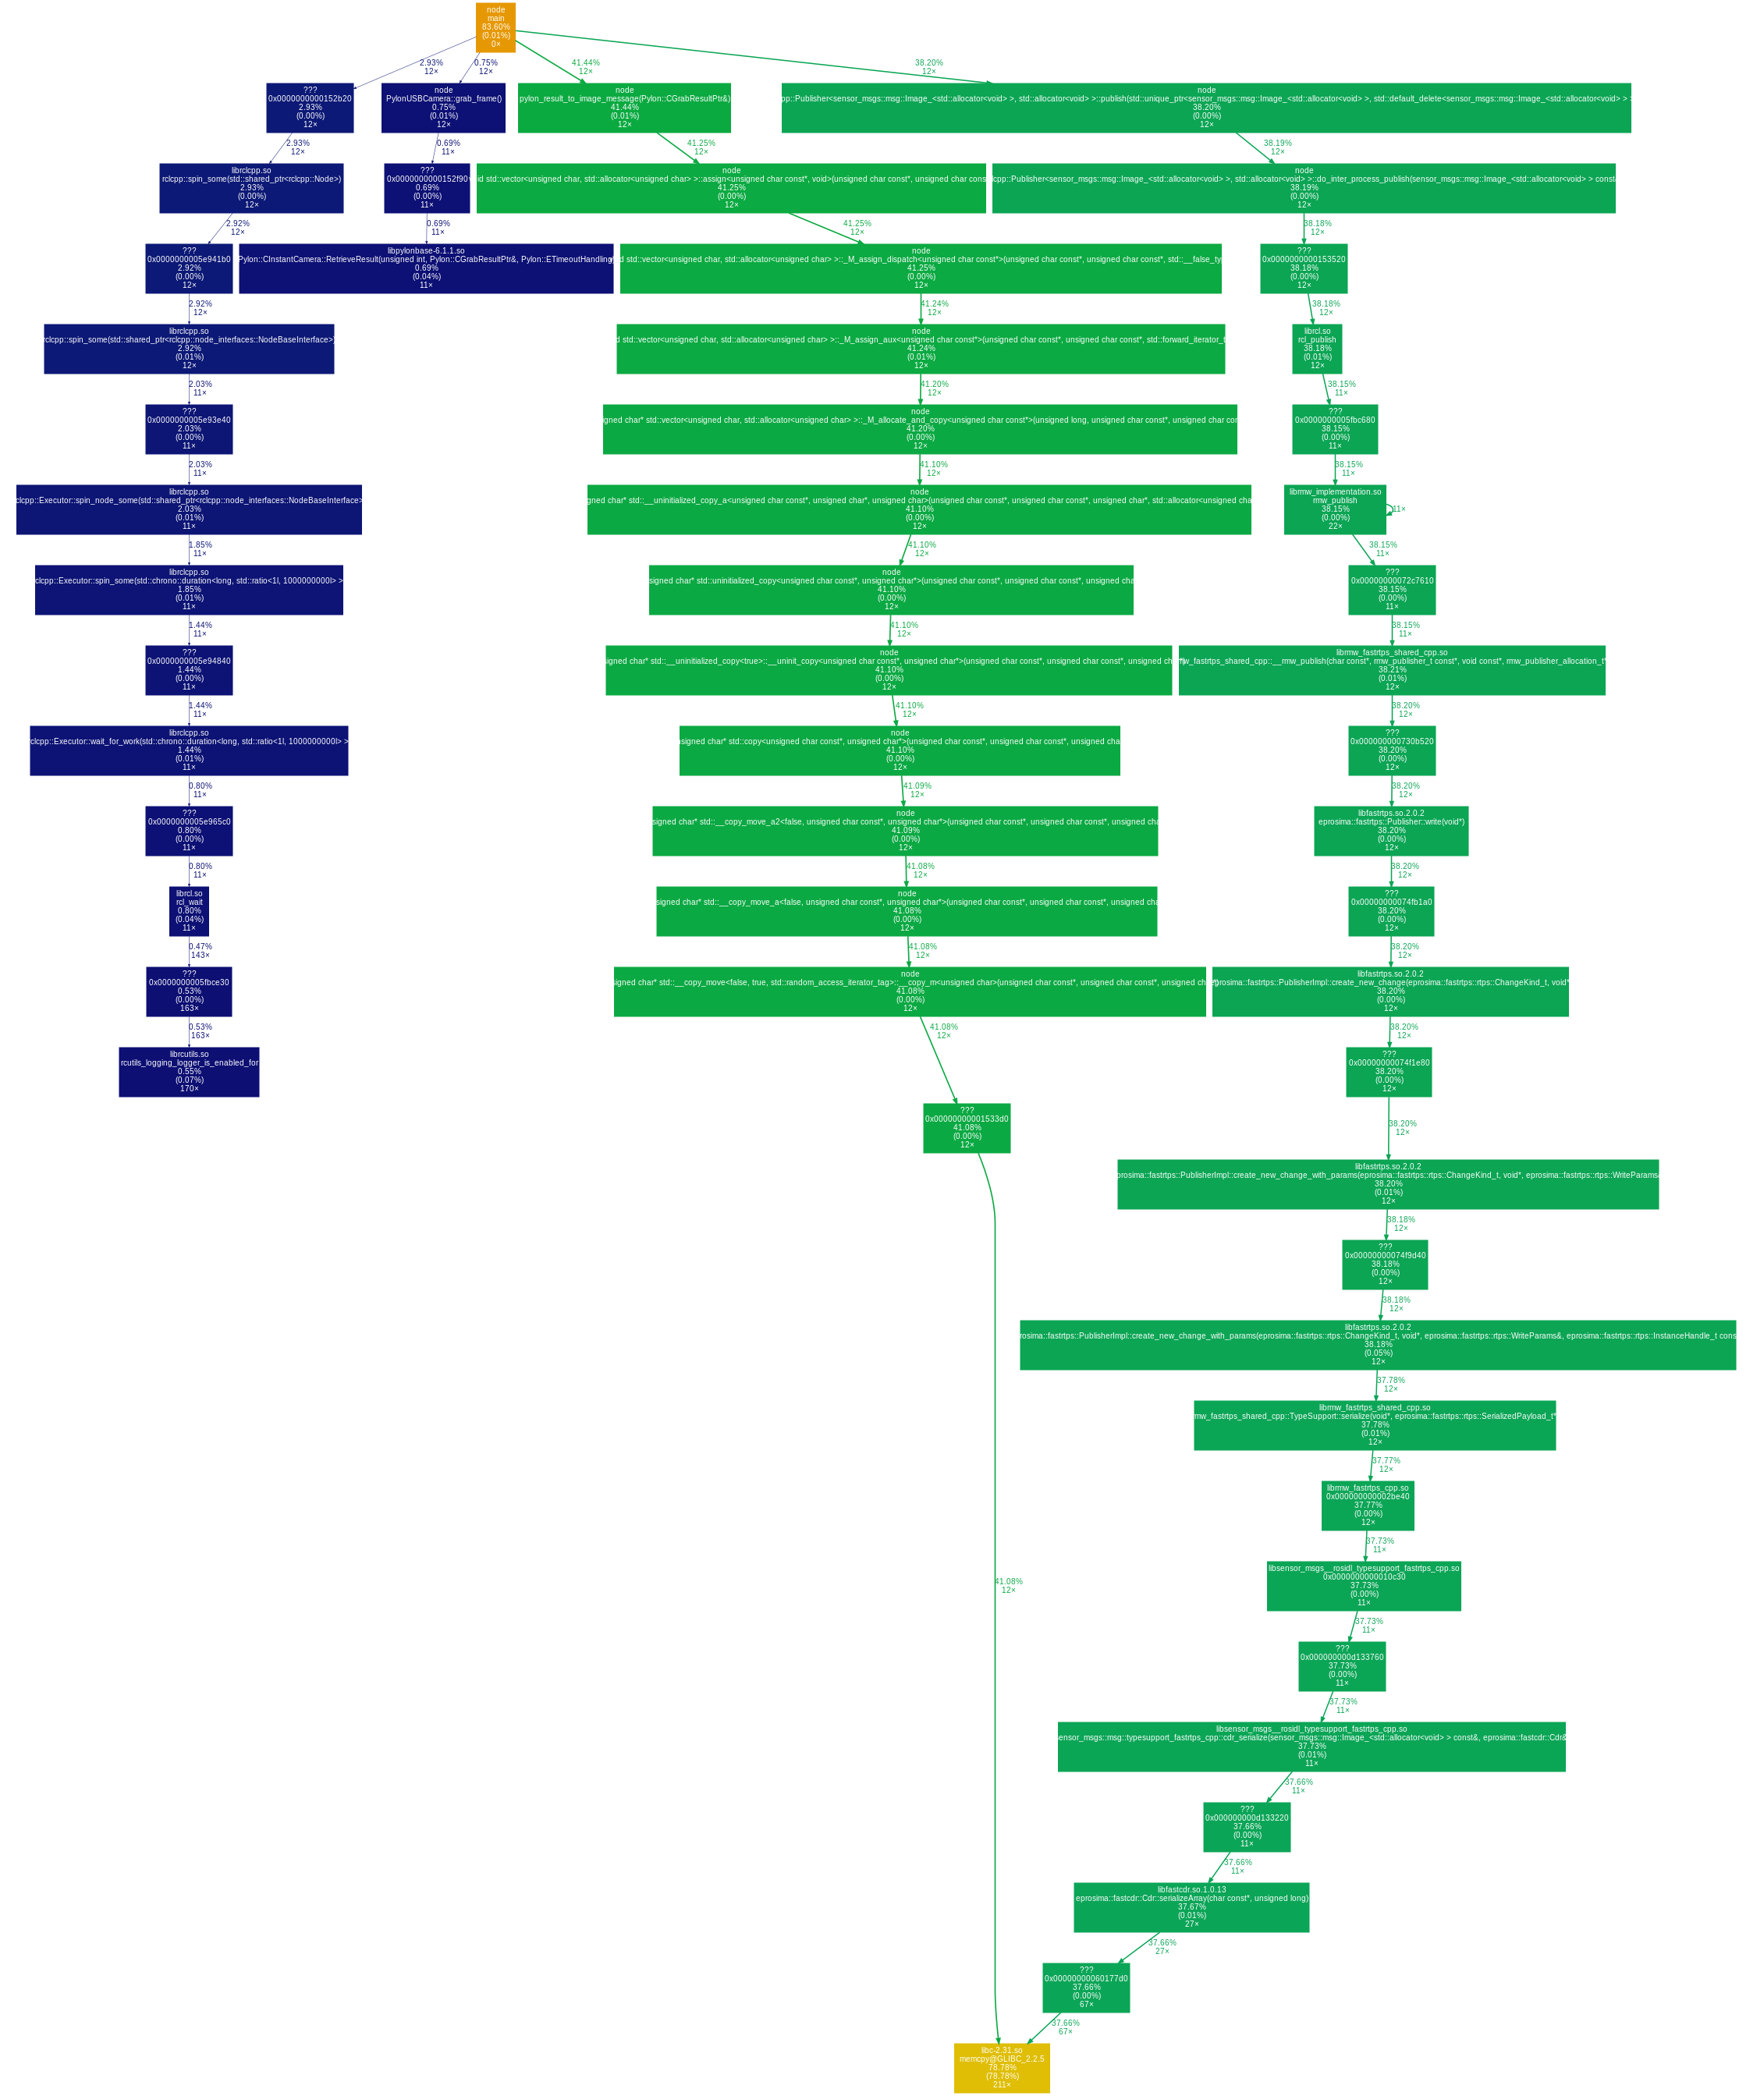
gprof
Some manual characterization of timing shows that none of my 'user space' code in timer callbacks is taking more than a few milliseconds, which means it is all inside the underlying Node spinning?
gprof shows output like:
  %   cumulative   self              self     total
 time   seconds   seconds    calls  us/call  us/call  name
 50.00      0.01     0.01      797     6.27     6.27  std::_Sp_counted_ptr_inplace<sensor_msgs::msg::Image_<std::allocator<void> >, std::allocator<sensor_msgs::msg::Image_<std::allocator<void> > >, (__gnu_cxx::_Lock_policy)2>::_M_dispose()
 50.00      0.01     0.01                             rclcpp::Subscription<sensor_msgs::msg::Image_<std::allocator<void> >, std::allocator<void> >::create_serialized_message()
(TODO revisit what gprof output actually means, re-run to see if output is similar)
I'm using https://github.com/lucasw/image_manip... to experiment with. I'm holding on to the same shared_ptr after creating it at init and republishing it, maybe I should create it anew for every publish? But if it is getting copied anyhow then that shouldn't be any different.
There isn't much cpu usage without a node receiving the image, when I do subscribe I observe the following with top:
- ros2 topic echo /image_raw shows a ros2 process at 104% cpu (!). (possibly related https://github.com/ros2/ros2/issues/509 )
- rqt_image_view shows a python3 process going up to 55% cpu. (In general I've stayed away from using python in ros2 for anything except transitory initialization scripts because cpu usage seems generally high, this is no exception)
- rviz2 Image viewer only takes about 35% cpu with same settings.
- My home grown imgui_ros takes about 25% cpu, though it has a lot going on within it that isn't a good example to dig into - the dependency on imgui and usage of raw OpenGL may be irrelevant to the issue but make the code more complicated.
And in all the cases the image publisher cpu jumps from 1 or 2 to 10%.
RMW_QOS_POLICY_RELIABILITY_BEST_EFFORT results in no images received at all in rqt_image_view, but clicking Unreliable in rviz2 makes them show up. ros2 topic echo will show the ...

Maybe related to https://github.com/ros2/ros2/issues/649 - though non-intra-process performance here is worse than non-nodelet performance in ros1 as I found in https://github.com/lucasw/ros2_cpp_py...
The number of threads created by each ros2 process maybe is related, though most of them are at zero cpu- possibly they contribute to the high memory usage https://answers.ros.org/question/3151...https://discourse.ros.org/t/monitorin...
From the answer to #q319218
https://discourse.ros.org/t/ros2-spee... "Is ROS2 slower than ROS1 or is there something I’m missing?". also https://discourse.ros.org/t/looking-f... "at some point in the ROS2 system we have built we are dropping messages"