
how to fix very low frame publish rate of turtlebot
Hi all,
I'm trying to use moveit it to control a turtlebot arm mounted on turtlebot. When I run my moveit.launch file, there's always a transform error:
[ERROR] [1543219008.768123467]: Transform error: Lookup would require extrapolation into the future.  Requested time 1543219008.716465048 but the latest data is at time 1543219008.605108938, when looking up transform from frame [wheel_left_link] to frame [camera_rgb_optical_frame]
[ERROR] [1543219008.768212737]: Transform cache was not updated. Self-filtering may fail.
[ERROR] [1543219009.818338395]: Transform error: Lookup would require extrapolation into the future.  Requested time 1543219009.718358101 but the latest data is at time 1543219009.712928056, when looking up transform from frame [arm_wrist_flex_servo_link] to frame [camera_rgb_optical_frame]
[ERROR] [1543219009.818410744]: Transform cache was not updated. Self-filtering may fail.
[ERROR] [1543219011.771677221]: Transform error: Lookup would require extrapolation into the future.  Requested time 1543219011.720434783 but the latest data is at time 1543219011.650256141, when looking up transform from frame [wheel_left_link] to frame [camera_rgb_optical_frame]
[ERROR] [1543219011.771738074]: Transform cache was not updated. Self-filtering may fail.
I then used tf view_frames to check the rate of each frame is pubshed at, and I found there are few frames are published at a very low rate:
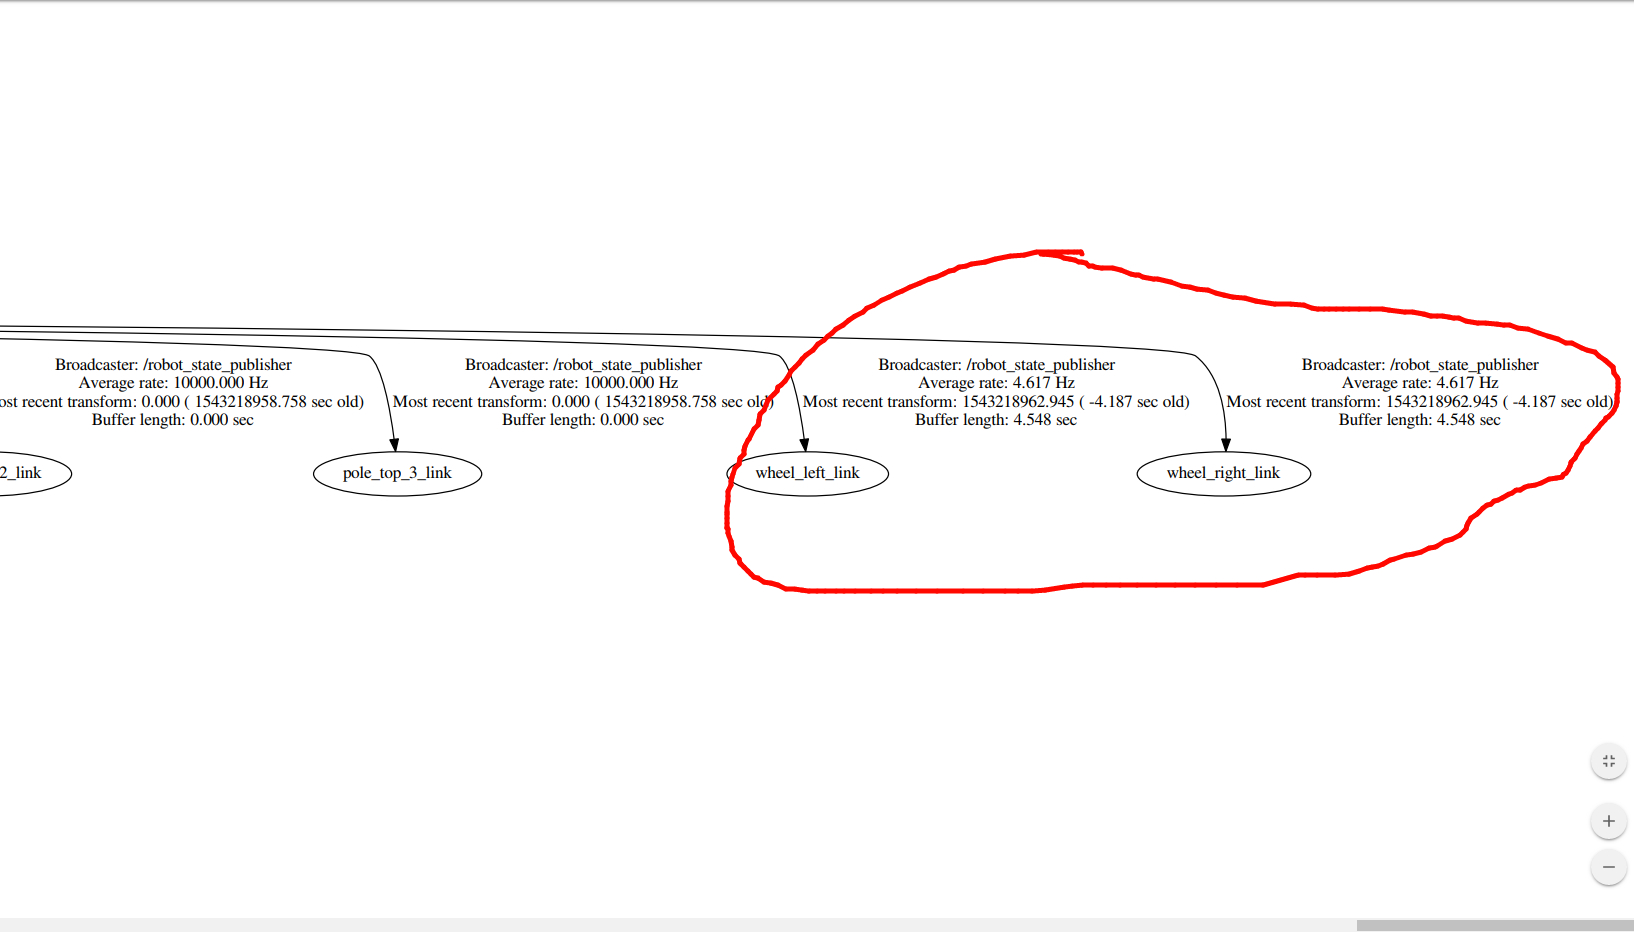
Is this low publishing rate causing the transform error? Why those tf frames are published at different rate while they were published by the same node? How can I fix this?
eidt 1:
CPU usage:
top - 08:03:29 up  5:35,  5 users,  load average: 0.15, 0.20, 0.14
Tasks: 239 total,   1 running, 194 sleeping,   0 stopped,   0 zombie
%Cpu(s):  3.4 us,  1.3 sy,  0.0 ni, 95.0 id,  0.1 wa,  0.0 hi,  0.2 si,  0.0 st
KiB Mem :  8057792 total,  6119848 free,  1028348 used,   909596 buff/cache
KiB Swap:  8278012 total,  8278012 free,        0 used.  6590016 avail Mem
  PID USER      PR  NI    VIRT    RES    SHR S  %CPU %MEM     TIME+ COMMAND
18363 river     20   0 1231972  42708  23304 S  12.3  0.5   0:32.60 nodelet
19677 river     20   0 1680908 131768  54924 S   5.6  1.6   0:26.04 move_group
17799 river     20   0  953512  21844  16036 S   1.7  0.3   0:05.06 nodelet
17877 river     20   0 1355884  74276  11640 S   1.7  0.9   0:05.22 python
17883 river     20   0  753564  51512   7220 S   1.0  0.6   0:02.52 python
17797 river     20   0  460608  15508  13452 S   0.7  0.2   0:01.63 robot_state_pub
18640 river     20   0  578952  13440  12068 S   0.7  0.2   0:00.32 nodelet
    8 root      20   0       0      0      0 I   0.3  0.0   0:48.82 rcu_sched
  928 root      20   0  337240  46872  26520 S   0.3  0.6   0:23.62 Xorg
17753 river     20   0  324964  55484   7684 S   0.3  0.7   0:00.69 roslaunch
17833 river     20   0  578952  13408  12048 S   0.3  0.2   0:00.43 nodelet
18346 river     20   0 ...
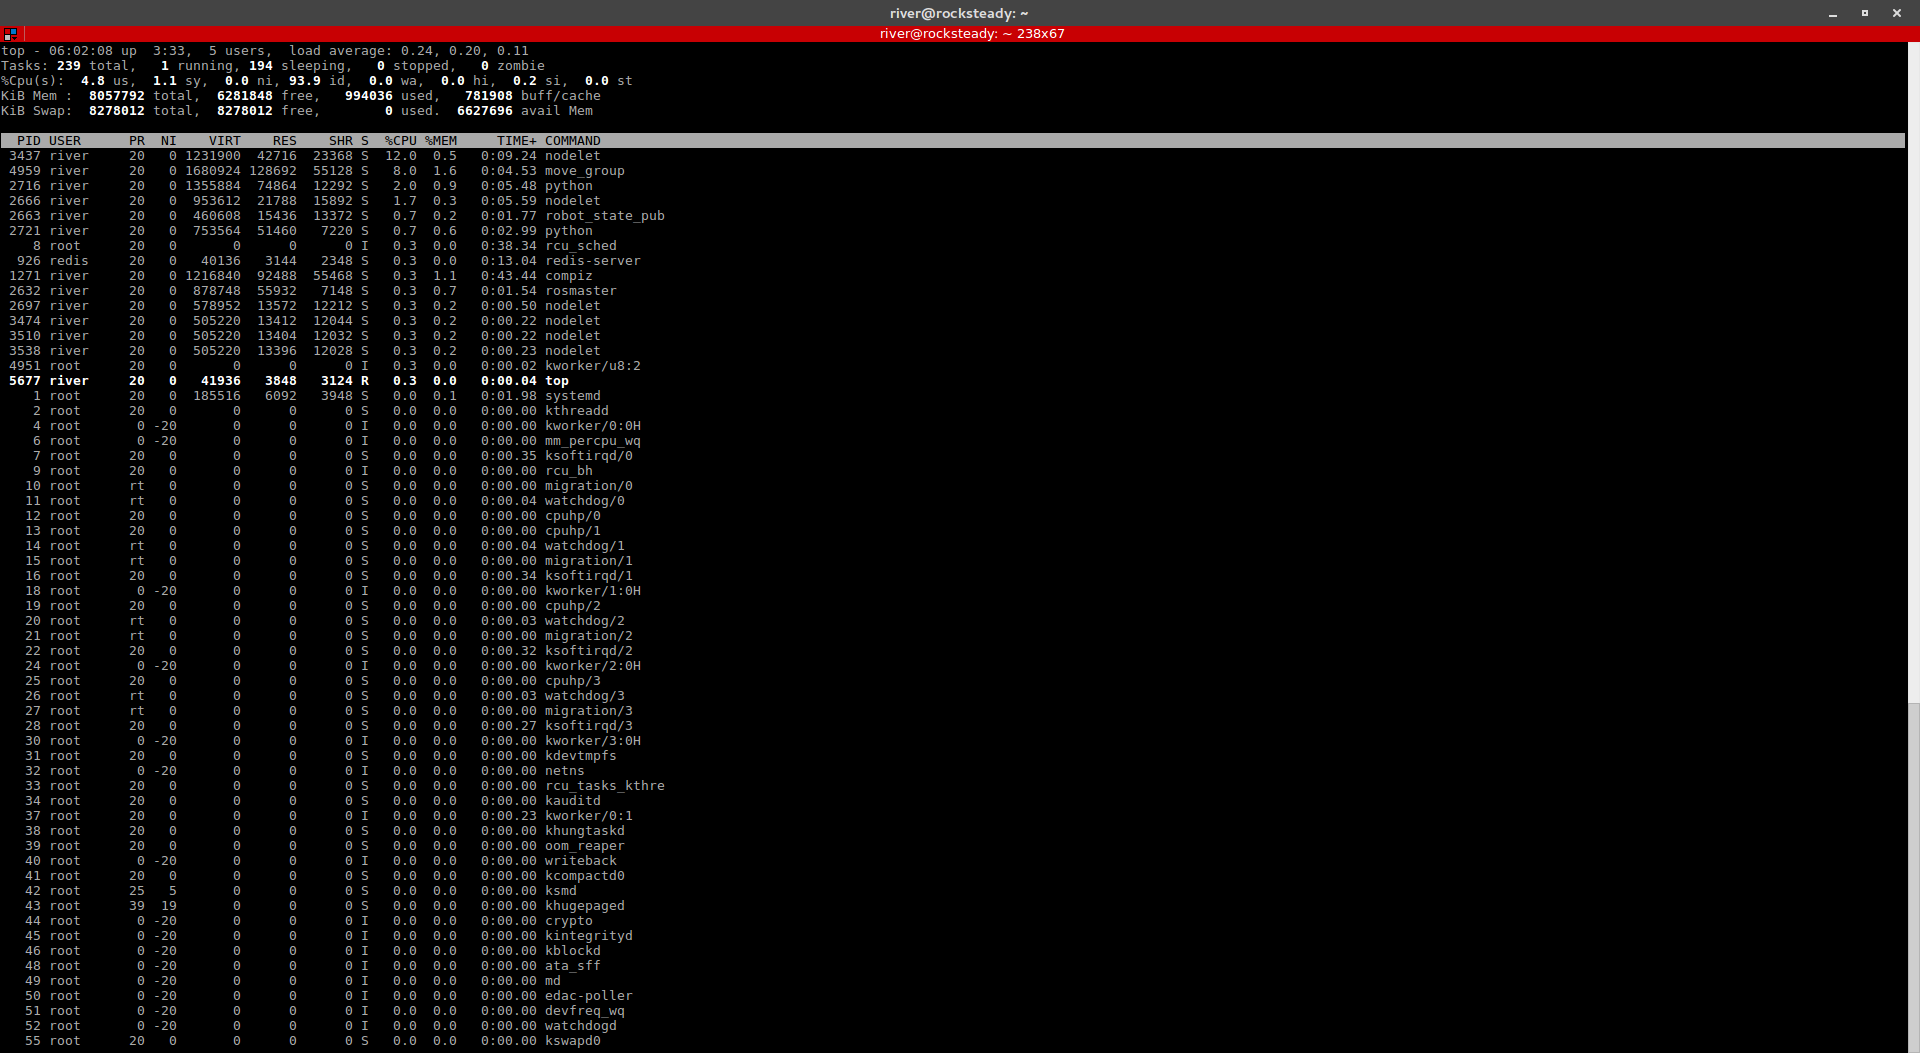
My first guess would be that your maxing out the CPU of the on-board computer. Can you run the linux command 'top' on the turtlebot while everything is running to test to hypothesis.
Please see the edit for the 'top' results. It seems not very bad to me. Thank you!
Can you please post it as text using copy and paste. Images can't be searched, and I can't read it on my phone at all.
Yes of course. Please see the updated edit. Hope the format works. Thank you!
How many cores does the on board computer have? The 12.3% looks suspiciously like a maxed core of an 8 core system.
Oh... Yes the on board pc does have a 8 cores CPU. It's a 7th i7 of a NUC. Is there anything I can do to solve this problem? I couldn't find many discussions regarding multi core moveit. Thank you!
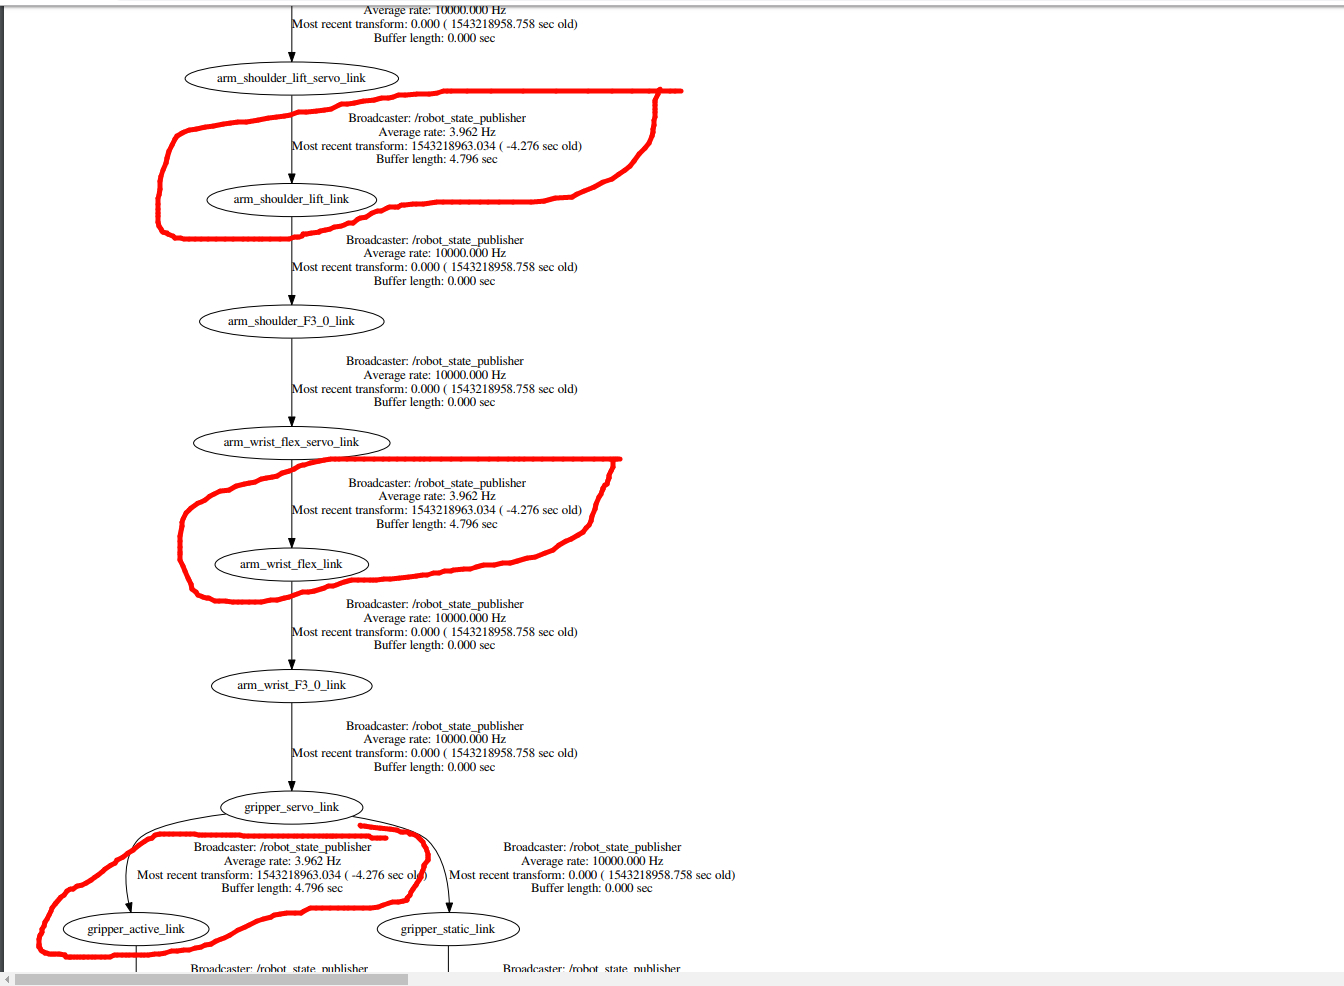
It seems very strange that some of the joints TFs are being published at a normal high rate while others are very slow. Can you think of anything common to all the slow ones? Such as a different hardware connection, or something similar.
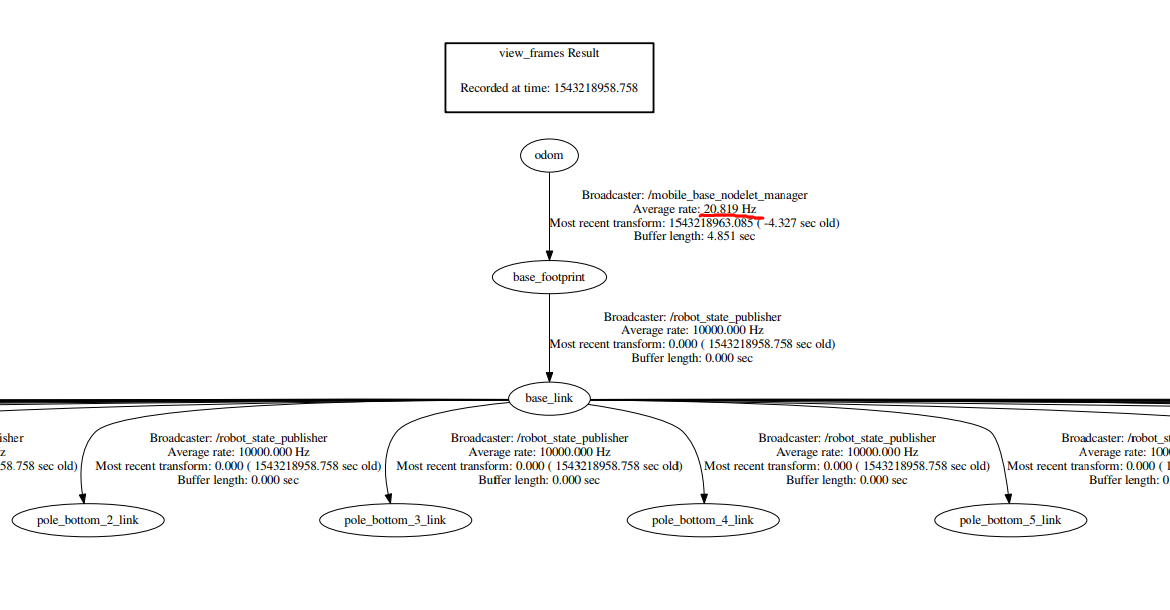
Yes they actually have something in common. Those other links being published at high rate are all fixed links, while those few being published at low rates are attached to active joints. I tried to increase the publish frequency of the robot state publisher in the turtlebot bringup launch, but...
... the maximum rate I can get is 20.819 Hz, which is the same as the rate of the /odom being published. HOWEVER, I just found this afternoon that even I keep getting those transform errors, moveit seems working actually. I can plan and execute trajectories for the arm and I also get the octomap.