ROS Resources: Documentation | Support | Discussion Forum | Index | Service Status | ros @ Robotics Stack Exchange
Ask Your Question
0

Using rqt_plot functionality with dictionary element in parameter

asked 2017-11-02 09:51:22 -0500

alfa_80 gravatar image

updated 2017-11-02 13:14:40 -0500

I've been trying to use rqt_plot functionality that involves dictionary but couldn't get it displayed. Obviously, something is not correct somewhere.

rostopic echo /gazebo/model_states

gives me something like below:

name: ['ground_plane', 'asphalt_plane', 'first_2015_trash_can']
pose: 
- 
position: 
  x: 0.0
  y: 0.0
  z: 0.0
orientation: 
  x: 0.0
  y: 0.0
  z: 0.0
  w: 1.0
- 
position: 
  x: 0.775434
  y: 2.97518
  z: 0.0
orientation: 
  x: 0.0
  y: 0.0
  z: 0.0
  w: 1.0
  - 
position: 
  x: 3.82387818665
  y: 3.40090985756
  z: 0.0500026991437
orientation: 
  x: 5.04793066057e-05
  y: -1.94916170948e-05
  z: -0.00420963773061
  w: 0.999991137972

What I'm interested in is the x-position of first_2015_trash_can i.e. one of the pose information of the third object. I've tried to do

rqt_plot /gazebo/model_states/name:'first_2015_trash_can'/pose/position/x

but didn't succeed. I've also tried:

rqt_plot  /gazebo/model_states/name[2]:pose/position/x

but doesn't work either.

Any ideas what could go wrong?

edit retag flag offensive close merge delete

2 Answers

Sort by ยป oldest newest most voted
1

answered 2017-11-06 10:11:01 -0500

jayess gravatar image

You were close but try something along the lines of

rqt_plot /gazebo/model_states/pose[2]/position/x

As far as I can tell, the name parameter tells you what position in the pose array to find the object that you want to examine so there's no need to use it with plotting. So, with my example we'd be looking at the x position of the first_2015_trash_can object. Also, note how I'm not using the :.

edit flag offensive delete link more

Comments

@jayess: Thanks a lot for the answer and explanation. But it still not working as the values for all elements give zero values. I guess there is a bug in the current rqt_plot. I have just upgraded the rqt_plot last week.

alfa_80 gravatar image alfa_80  ( 2017-11-07 04:23:27 -0500 )edit
0

answered 2018-05-15 05:23:55 -0500

Davide Faconti gravatar image

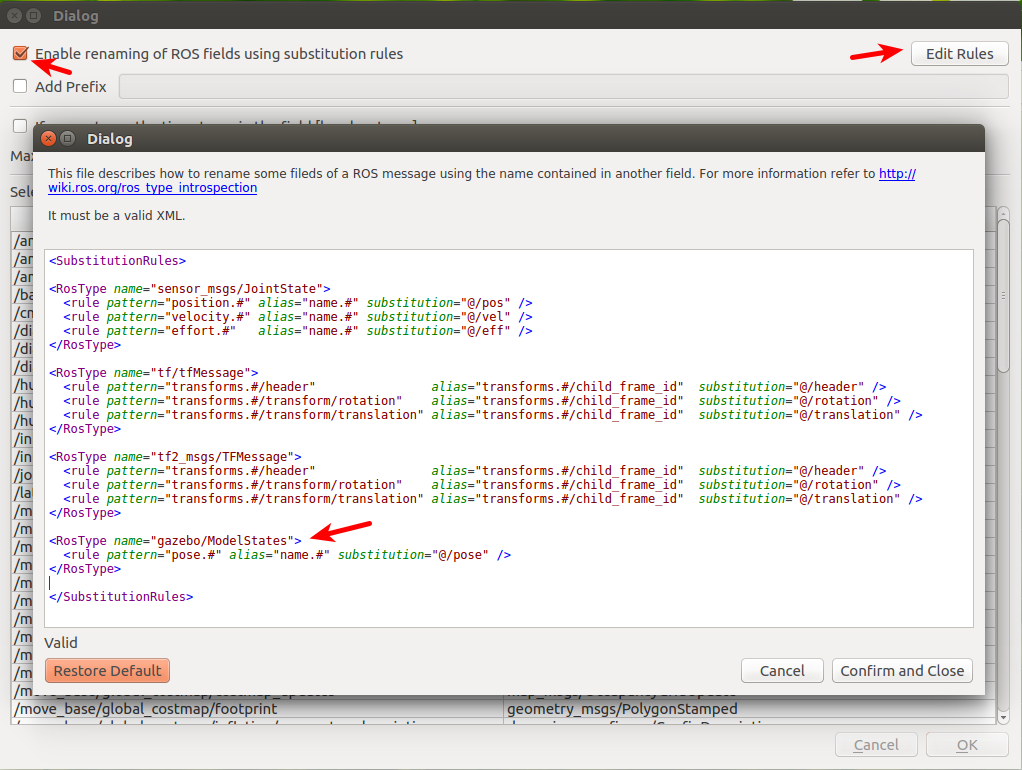
You can do this using PlotJuggler instead of rqt_plot.

There is an option called "renaming using substitution rule". In the attached picture you can see the substitution rule that you need.

image description

edit flag offensive delete link more

Question Tools

1 follower

Stats

Asked: 2017-11-02 09:51:22 -0500

Seen: 388 times

Last updated: May 15 '18