ROS Resources: Documentation | Support | Discussion Forum | Index | Service Status | ros @ Robotics Stack Exchange
Ask Your Question
0

How to plot the path and the movement of a robot?

asked 2017-03-29 05:58:07 -0500

Turtle gravatar image

updated 2017-03-29 07:41:07 -0500

I am using turtlebot in gazebo and rviz. The robot moves from A to B, and I am wondering if there is an easy way (without the need to use matlab) to plot

  1. the path that robot finds (e.g. based on the situation the robot can choose different path)
  2. the movement of the robot from it's current position to the goal (how robot moves to reach its goal)
  3. the robot's distance to obstacles around
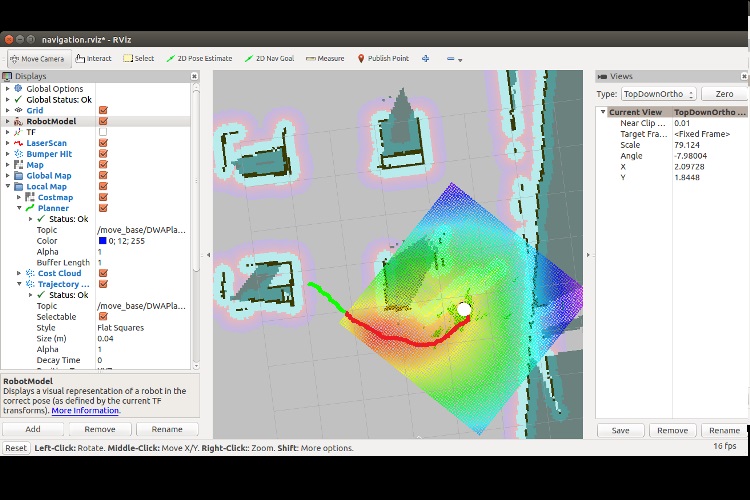
link:Image

Using rqt_plot can solve this problem?

edit retag flag offensive close merge delete

1 Answer

Sort by ยป oldest newest most voted
1

answered 2017-04-25 05:13:55 -0500

Davide Faconti gravatar image

rqt_plot will plot this information if you publish it in a topic. Let's see in more detail what you want to do, first:

  1. the path that robot finds: This is best displayed in RViz IMHO, because it will be super-posed to the map.
  2. You need a XY plot, rather than the time-series visualization provided by rqt_plot
  3. you need to publish this information if you want a graphic tool to be able to visualize it.

I suggest you to take a look at

https://github.com/facontidavide/Plot...

https://vimeo.com/214389001

Cheers

edit flag offensive delete link more

Question Tools

2 followers

Stats

Asked: 2017-03-29 05:58:07 -0500

Seen: 3,703 times

Last updated: Apr 25 '17