ROS Resources: Documentation | Support | Discussion Forum | Index | Service Status | ros @ Robotics Stack Exchange
Ask Your Question
1

How do I use rqt_plot to subscribe to std_msgs

asked 2016-02-14 08:27:03 -0500

user23fj239 gravatar image

updated 2016-02-14 08:35:06 -0500

I do have an Array from #include "std_msgs/Float64MultiArray.h" and it is constituted as followed:

layout: 
  dim: []
  data_offset: 0
data: [0.0073274714, -0.019451106, -0.009992006]
---

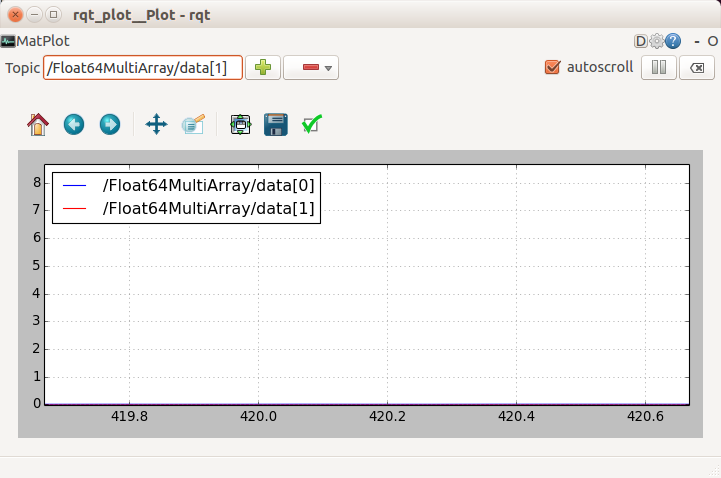
Now, if I use rqt_plot it does not show any data when selecting the topic. I cannot figure out why? If I hover over the + button in the GUI it just says no plottable fields.

edit retag flag offensive close merge delete

Comments

Are you sure that empty dim field is correct? I wouldn't be surprised if rqt_plot cannot work with *Array msgs that have no valid dimensions associated with them.

gvdhoorn gravatar image gvdhoorn  ( 2016-02-14 08:38:10 -0500 )edit

how do I fill in the dim field? What i do so far is

      arr.data.clear();
    arr.data.push_back( x);
    arr.data.push_back( y);
user23fj239 gravatar image user23fj239  ( 2016-02-14 08:42:20 -0500 )edit

1 Answer

Sort by ยป oldest newest most voted
1

answered 2016-02-14 08:41:20 -0500

user23fj239 gravatar image

updated 2016-02-14 08:43:07 -0500

After having a look at this I figured it out as /Float64MultiArray/data[0] fo the first entry of the array with data being the array-name.
image description

edit flag offensive delete link more

Question Tools

1 follower

Stats

Asked: 2016-02-14 08:27:03 -0500

Seen: 825 times

Last updated: Feb 14 '16