ROS Resources: Documentation | Support | Discussion Forum | Index | Service Status | ros @ Robotics Stack Exchange
Ask Your Question
0

PR2 Calibration Graphs and Improvement

asked 2011-08-10 07:47:37 -0500

David Lu gravatar image

updated 2014-11-22 17:05:40 -0500

ngrennan gravatar image

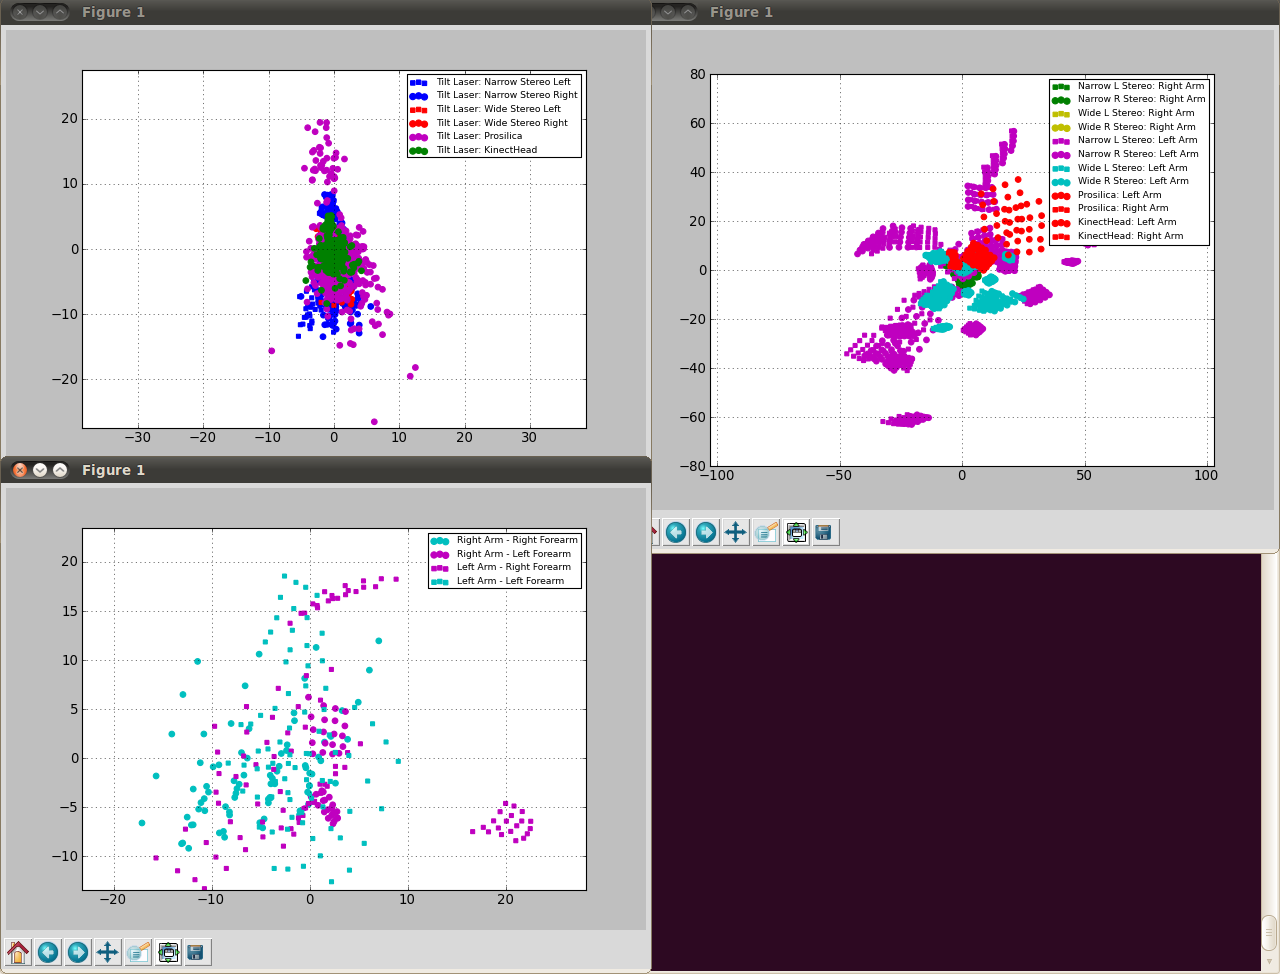
I've performed the calibration of our PR2 three times, yet it doesn't seem quite calibrated yet. I've been using this tutorial and recommends you view the experimental errors with view_head_laser_scatter.sh et al.

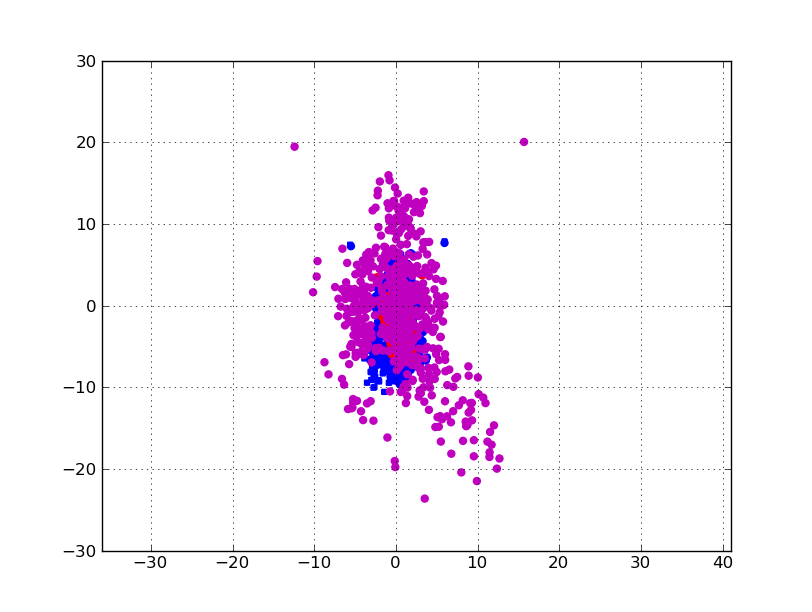
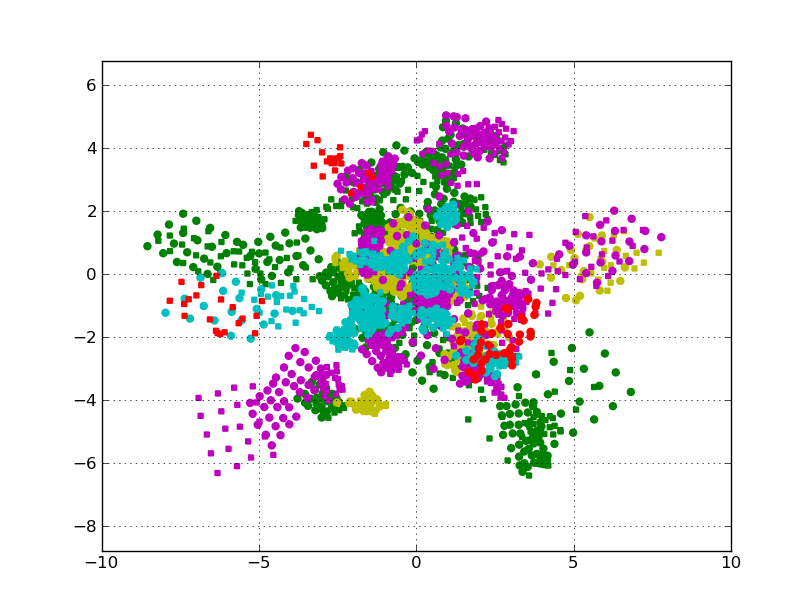
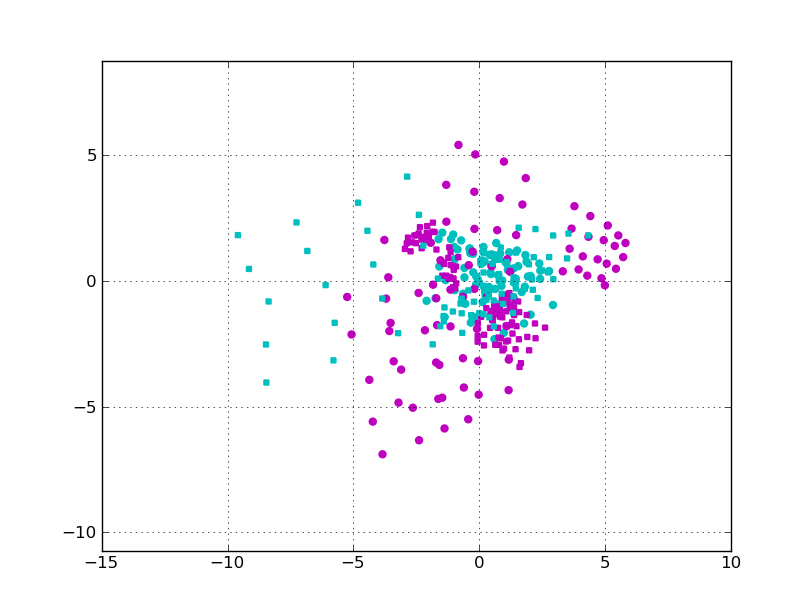
Here are the three graphs I get as a result. Head Laser Head Arm Forearm

Two part question:

1) How should I interpret these graphs?

2) What can I do to improve the accuracy?

I can upload my cal_measurements.bag if needed. It has 75 robot_measurements in it.

edit retag flag offensive close merge delete

2 Answers

Sort by ยป oldest newest most voted
5

answered 2011-09-02 11:47:07 -0500

ahendrix gravatar image

Firstly, these would be acceptable calibration charts if we were doing the calibration in-house.

The purple data points on the first graph are the error between the Prosilica camera and the head laser. Since this camera has a higher resolution, it also tends to have higher error; we generally accept values around 20-30px for that plot.

edit flag offensive delete link more
0

answered 2012-07-25 06:05:27 -0500

We just upgraded to Fuerte and did a full system calibration on the PR2. The results are notably bad (see plot image [0]), especially the sensor to arm calibration errors. We did it twice with almost the same result.

Does anyone have the same issue after upgrading to Fuerte? Any suggestions on what might be the reason or what can improve the result?

P.S. I wanted to post this as a comment to your answer, but there was no comment field.

[0] http://tams.informatik.uni-hamburg.de/people/rockel/img/calibration_plots_120725_b.png

edit flag offensive delete link more

Question Tools

Stats

Asked: 2011-08-10 07:47:37 -0500

Seen: 551 times

Last updated: Jul 25 '12