
The site is read-only. Please transition to use Robotics Stack Exchange
| ROS Resources: Documentation | Support | Discussion Forum | Index | Service Status | ros @ Robotics Stack Exchange |
| | 1 | initial version |
Yes it is possible, however the tricky part is selecting the correct process when you are attaching your debugger.
As an example, I can show you how I set a breakpoint in the talker node of the composition demo.
Follow the instructions here. You should simply add the following to your launch.json
{ "configurations": [ { "name": "ROS: Attach", "type": "ros", "request": "attach" } ] }
Launch your component container, in this case ros2 launch composition ./composition_demo.launch.py
ROS: Attach debug target in vscode. Pick c++; when you get the drop down menu to choose a process, look for the one running the component container, not the launch file. As illustrated in the screenshot below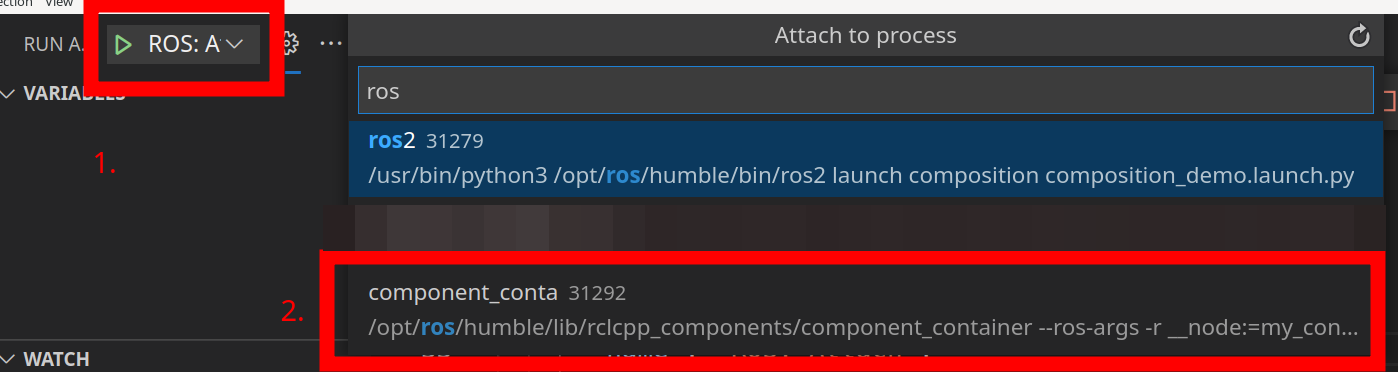
| | 2 | No.2 Revision |
Yes it is possible, however the tricky part is selecting the correct process when you are attaching your debugger.
As an example, I can show you how I set a breakpoint in the talker node of the composition demo.
Follow the instructions here. You should simply add the following to your launch.json
{ "configurations": [ { "name": "ROS: Attach", "type": "ros", "request": "attach" } ] }
Launch your component container, in this case ros2 launch composition ./composition_demo.launch.py
ROS: Attach debug target in vscode. Pick c++; when you get the drop down menu to choose a process, look for the one running the component container, not the launch file. As illustrated in the screenshot
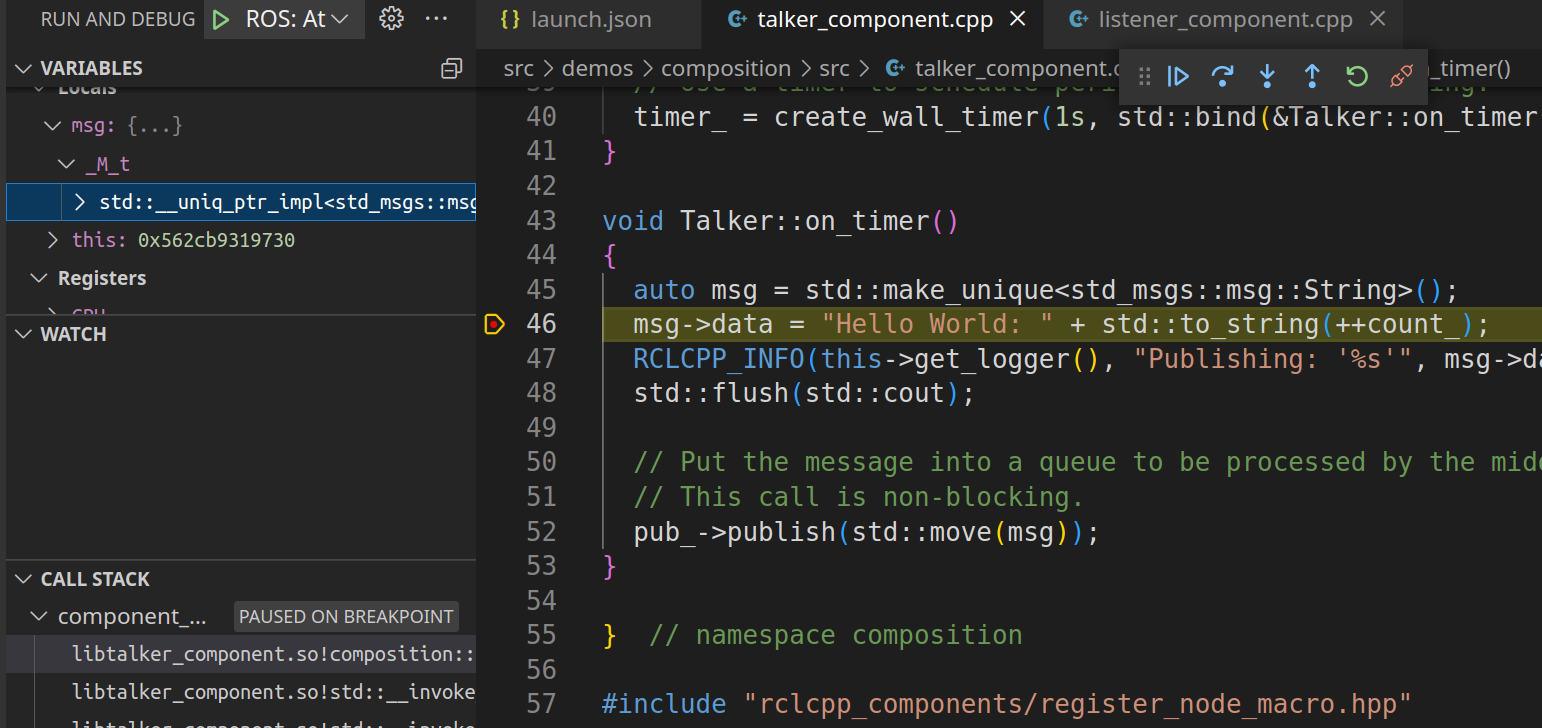
Finally, place
a breakpoint somewhere to stop the program
 ROS Answers is licensed under Creative Commons Attribution 3.0 Content on this site is licensed under a Creative Commons Attribution Share Alike 3.0 license.