
The site is read-only. Please transition to use Robotics Stack Exchange
| ROS Resources: Documentation | Support | Discussion Forum | Index | Service Status | ros @ Robotics Stack Exchange |
| | 1 | initial version |
I ran into same question and what we found so far...
For example, we have transformation between world, earth, moon, and we want to plot time-series data of transform between world and moon
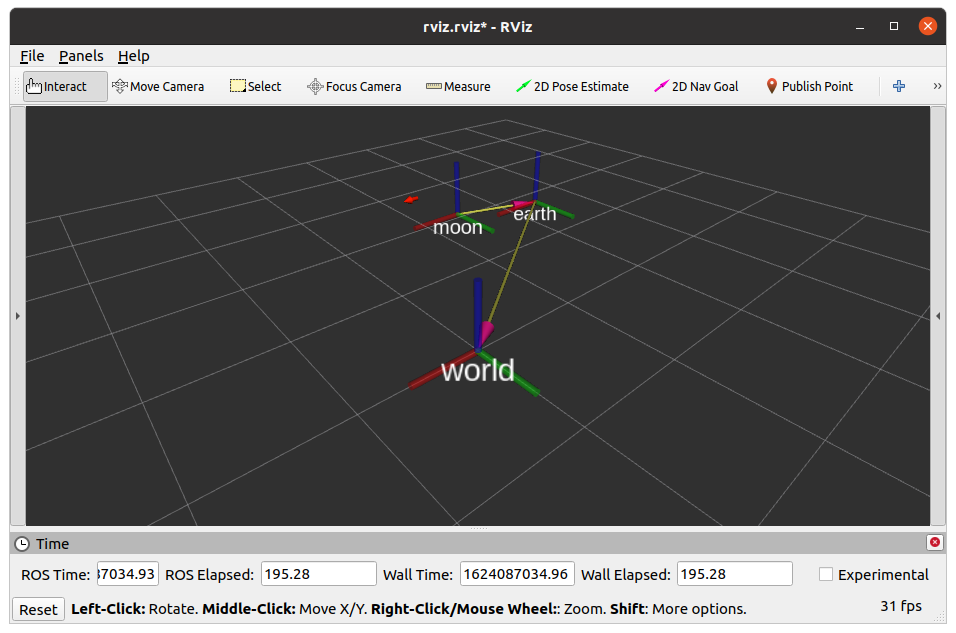
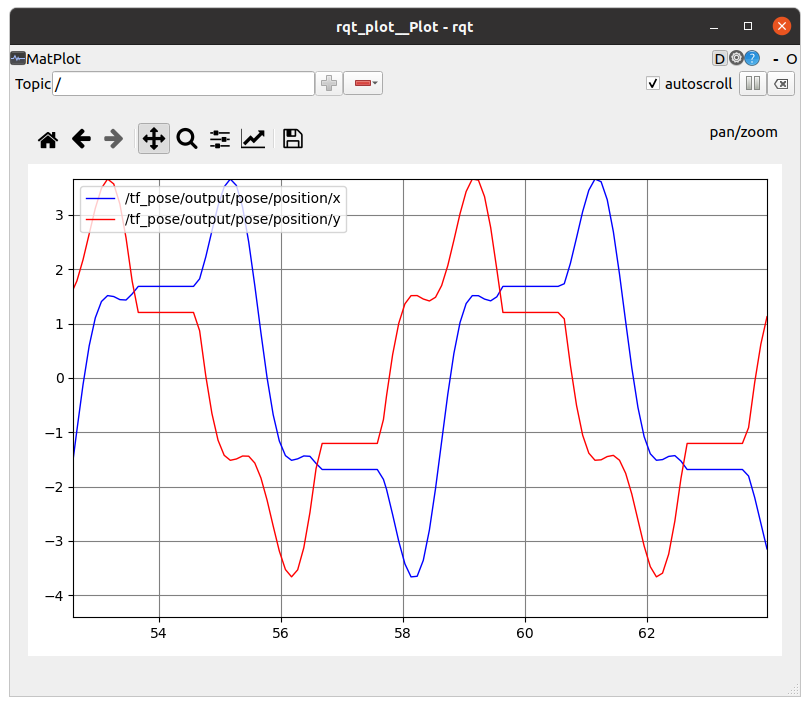
1) Convert world <- moon TF transform to PoseStamped (and others) and plot using rqt_plot
tf_to_pose.py convert arbitrary transform to geometry_msgs/PoseStamped message, which is easy to plot by rqt_plot tool
2) Rebroadcast world <- moon TF transforms with different name, ad world <- moon2, then plot with plotjuggler
plotjuggler capable of plot tf transform ONLY between child frame and parent frame. So if we can rebroadcast tf transforms with different frame id on the fly

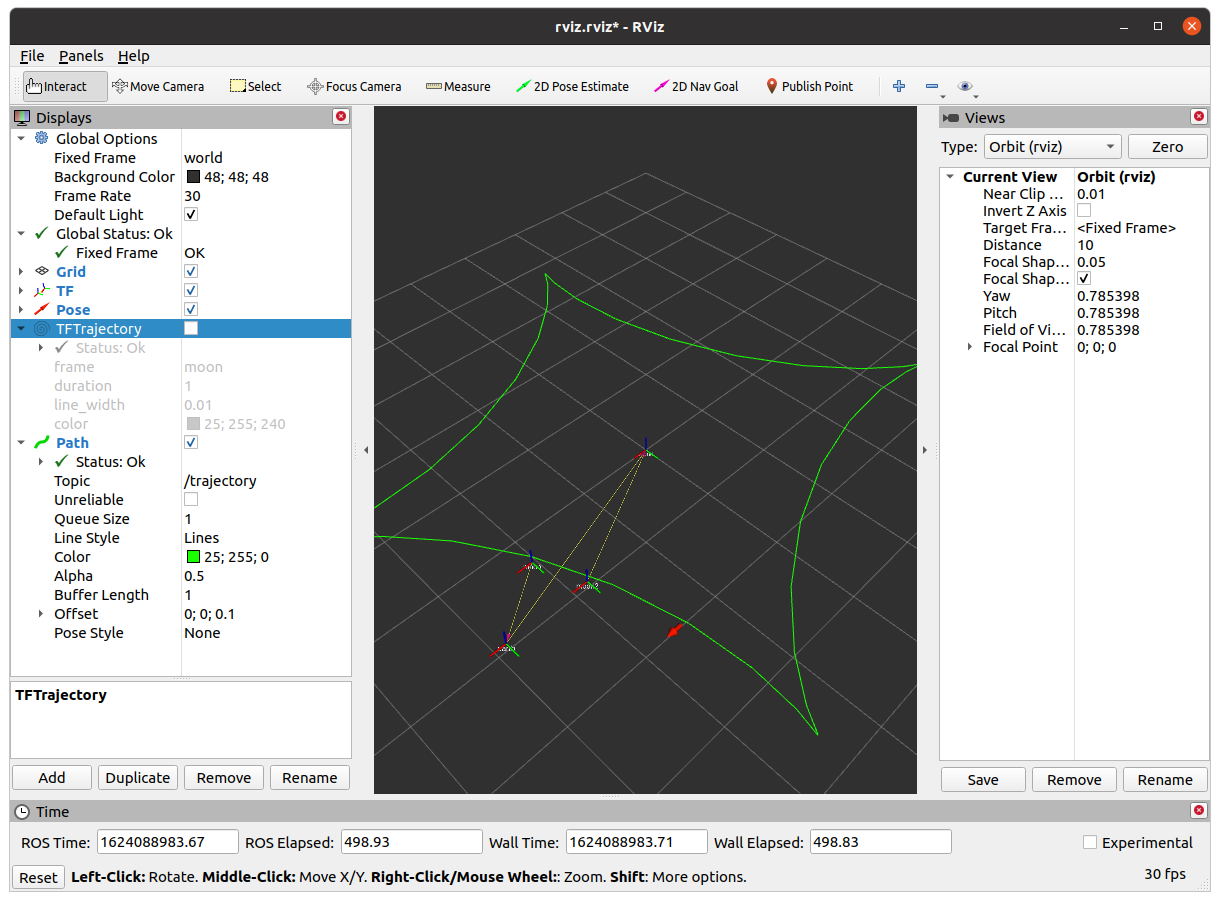
3) use rviz plugins
duplicated questions in answers.ros.org suggested few useful links, for example tf_trajectory shows
4) use hector_trajectory_server
duplicated questions in answers.ros.org also suggested to use hector_trajectory_server, you can visualize as Path on rviz, but I personally do not know how to plot on rqt and other tools.
You can find example code at https://gist.github.com/k-okada/8d4f6169216fd168a4649a3c1d12aa22
 ROS Answers is licensed under Creative Commons Attribution 3.0 Content on this site is licensed under a Creative Commons Attribution Share Alike 3.0 license.
