
The site is read-only. Please transition to use Robotics Stack Exchange
| ROS Resources: Documentation | Support | Discussion Forum | Index | Service Status | ros @ Robotics Stack Exchange |
| | 1 | initial version |
Submitting an answer to my own question since I didn't get any answers.
I ended up doing pretty much what I described in my question. Full post here: https://christophebedard.com/ros-tracing-message-flow/
| | 2 | No.2 Revision |
Submitting an answer to my own question since I didn't get any answers.
I ended up doing pretty much what I described in my question. Full post here: https://christophebedard.com/ros-tracing-message-flow/
Here's a summary/excerpt:
In order to do what I've described above, similar to what I mentioned, some information is needed on:
We first need to know about connections between nodes. The ROS instrumentation includes a tracepoint for new connections (new_connection). It includes the address and port of the host and the destination, with an address:port pair corresponding to a specific publisher or subscription.
We also need to build a model of the publisher and subscriber queues. To achieve this, we can leverage the relevant tracepoints. These include a tracepoint for when a message is added to the queue (publisher_message_queued, subscription_message_queued), when it’s dropped from the queue (subscriber_link_message_dropped, subscription_message_dropped), and when it leaves the queue (either sent over the network to the subscriber (subscriber_link_message_write), or handed over to a callback (subscriber_callback_start)). We can therefore visualize the state of a queue over time!
Finally, we need information on network packet exchanges. Although this isn’t really necessary for this kind of analysis, it allows us to reliably link a message that gets published to a message that gets received by the subscriber. This is good when building a robust analysis, and it paves the way for a future critical path analysis based on this message flow analysis.
This requires us to trace both userspace (ROS) and kernel. Fortunately, we only have to enable 2 kernel events for this (net_dev_queue for packet queuing and netif_receive_skb for packet reception). It saves us a lot of disk space, since enabling many events can generate multiple gigabytes of trace data, even when tracing for only a few seconds! Also, as the rate of generated events increases, the overhead also increases. More resources have to be allocated to the buffers to properly process those events, otherwise they can get discarded or overwritten.
Result:
C:\fakepath\result_analysis_initial_zoom.png
Some links for actual code/further information:
| | 3 | No.3 Revision |
Submitting an answer to my own question since I didn't get any answers.
I ended up doing pretty much what I described in my question. Full post here: https://christophebedard.com/ros-tracing-message-flow/
Here's a summary/excerpt:
In order to do what I've described above, similar to what I mentioned, some information is needed on:
We first need to know about connections between nodes. The ROS instrumentation includes a tracepoint for new connections (new_connection). It includes the address and port of the host and the destination, with an address:port pair corresponding to a specific publisher or subscription.
We also need to build a model of the publisher and subscriber queues. To achieve this, we can leverage the relevant tracepoints. These include a tracepoint for when a message is added to the queue (publisher_message_queued, subscription_message_queued), when it’s dropped from the queue (subscriber_link_message_dropped, subscription_message_dropped), and when it leaves the queue (either sent over the network to the subscriber (subscriber_link_message_write), or handed over to a callback (subscriber_callback_start)). We can therefore visualize the state of a queue over time!
Finally, we need information on network packet exchanges. Although this isn’t really necessary for this kind of analysis, it allows us to reliably link a message that gets published to a message that gets received by the subscriber. This is good when building a robust analysis, and it paves the way for a future critical path analysis based on this message flow analysis.
This requires us to trace both userspace (ROS) and kernel. Fortunately, we only have to enable 2 kernel events for this (net_dev_queue for packet queuing and netif_receive_skb for packet reception). It saves us a lot of disk space, since enabling many events can generate multiple gigabytes of trace data, even when tracing for only a few seconds! Also, as the rate of generated events increases, the overhead also increases. More resources have to be allocated to the buffers to properly process those events, otherwise they can get discarded or overwritten.
Result:
C:\fakepath\result_analysis_initial_zoom.png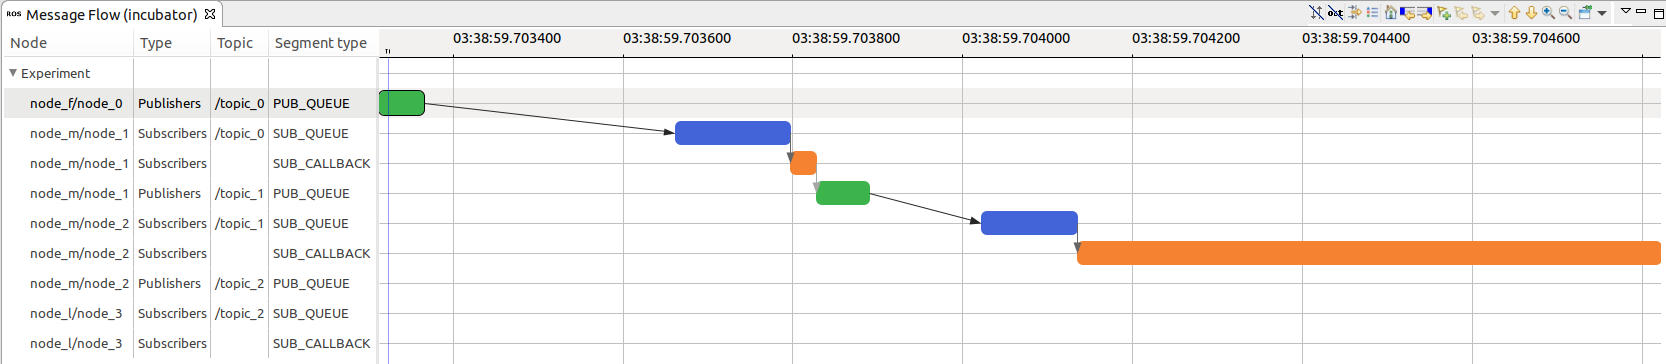
Some links for actual code/further information:
 ROS Answers is licensed under Creative Commons Attribution 3.0 Content on this site is licensed under a Creative Commons Attribution Share Alike 3.0 license.
