
The site is read-only. Please transition to use Robotics Stack Exchange
| ROS Resources: Documentation | Support | Discussion Forum | Index | Service Status | ros @ Robotics Stack Exchange |
| | 1 | initial version |
Not nice but the easiest is to just republish it I guess.
import rospy
from std_msgs.msg import String, Float64

rospy.init_node("spam")
p = rospy.Publisher("/topic_out", Float64)

def callback(msg):
    p.publish(float(msg.data))

rospy.Subscriber("/topic_in", String, callback)
rospy.spin()
| | 2 | No.2 Revision |
Not nice but the easiest is to just republish it I guess.
import rospy
from std_msgs.msg import String, Float64

rospy.init_node("spam")
p = rospy.Publisher("/topic_out", Float64)

def callback(msg):
    p.publish(float(msg.data))

rospy.Subscriber("/topic_in", String, callback)
rospy.spin()
EDIT: You can also write a script that reads from the bag and writes to a new one. Have a look at the rosbag API for that.
| | 3 | No.3 Revision |
Not nice but the easiest is to just republish it I guess.
import rospy
from std_msgs.msg import String, Float64

rospy.init_node("spam")
p = rospy.Publisher("/topic_out", Float64)

def callback(msg):
    p.publish(float(msg.data))

rospy.Subscriber("/topic_in", String, callback)
rospy.spin()
EDIT: You can also write a script that reads from the bag and writes to a new one. Have a look at the rosbag API for that.
EDIT 2:
I am not entirely sure how you subscribe to what but here is how it works for me:
Let's assume I have a node like this that produces the data:
import rospy
import numpy as np
from std_msgs.msg import String

rospy.init_node("data_node")

p = rospy.Publisher("/string_topic", String, queue_size=1)

Fs = 8000
f = 5
sample = 8000
x = np.arange(sample)
y = np.sin(2 * np.pi * f * x / Fs)

r = rospy.Rate(10)
for e in y:
    p.publish(str(e))
    r.sleep()
which just produces a sine wave and then I save that to a rosbag rosbag record /string_topic which generates the following bag
path:        2016-07-28-08-06-26.bag
version:     2.0
duration:    2:46s (166s)
start:       Jul 28 2016 08:06:29.43 (1469689589.43)
end:         Jul 28 2016 08:09:16.33 (1469689756.33)
size:        129.3 KB
messages:    1670
compression: none [1/1 chunks]
types:       std_msgs/String [992ce8a1687cec8c8bd883ec73ca41d1]
topics:      /string_topic   1670 msgs    : std_msgs/String
This I can then play rosbag play 2016-07-28-08-06-26.bag and use the script I posted above to subscribe to /string_topic:
import rospy
from std_msgs.msg import String, Float64

rospy.init_node("spam")
p = rospy.Publisher("/float_topic", Float64)

def callback(msg):
    p.publish(float(msg.data))

rospy.Subscriber("/string_topic", String, callback)
rospy.spin()
I can the connect /float_topic to rqt_plot and see my data. My connection graph looks likes this:
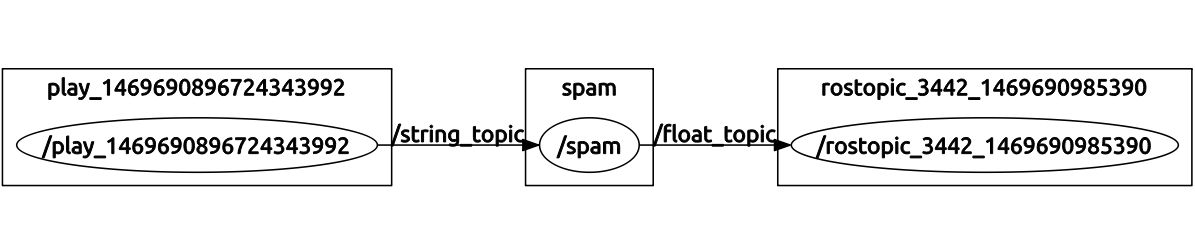
Where on the left you have the rosbag and on the right the rqt_plot.
Maybe your bag contains just the same number in all the messages? Can you upload it somewhere or post some of the example output of the topic you want to plot. Also, the output of rosbag info on your bag would be good.
| | 4 | No.4 Revision |
Not nice but the easiest is to just republish it I guess.
import rospy
from std_msgs.msg import String, Float64

rospy.init_node("spam")
p = rospy.Publisher("/topic_out", Float64)

def callback(msg):
    p.publish(float(msg.data))

rospy.Subscriber("/topic_in", String, callback)
rospy.spin()
EDIT: You can also write a script that reads from the bag and writes to a new one. Have a look at the rosbag API for that.
EDIT 2:
I am not entirely sure how you subscribe to what but here is how it works for me:
Let's assume I have a node like this that produces the data:
import rospy
import numpy as np
from std_msgs.msg import String

rospy.init_node("data_node")

p = rospy.Publisher("/string_topic", String, queue_size=1)

Fs = 8000
f = 5
sample = 8000
x = np.arange(sample)
y = np.sin(2 * np.pi * f * x / Fs)

r = rospy.Rate(10)
for e in y:
    p.publish(str(e))
    r.sleep()
which just produces a sine wave and then I save that to a rosbag rosbag record /string_topic which generates the following bag
path:        2016-07-28-08-06-26.bag
version:     2.0
duration:    2:46s (166s)
start:       Jul 28 2016 08:06:29.43 (1469689589.43)
end:         Jul 28 2016 08:09:16.33 (1469689756.33)
size:        129.3 KB
messages:    1670
compression: none [1/1 chunks]
types:       std_msgs/String [992ce8a1687cec8c8bd883ec73ca41d1]
topics:      /string_topic   1670 msgs    : std_msgs/String
This I can then play rosbag play 2016-07-28-08-06-26.bag and use the script I posted above to subscribe to /string_topic:
import rospy
from std_msgs.msg import String, Float64

rospy.init_node("spam")
p = rospy.Publisher("/float_topic", Float64)

def callback(msg):
    p.publish(float(msg.data))

rospy.Subscriber("/string_topic", String, callback)
rospy.spin()
I can the connect /float_topic to rqt_plot and see my data. My connection graph looks likes this:
Where on the left you have the rosbag and on the right the rqt_plot.
Maybe your bag contains just the same number in all the messages? Can you upload it somewhere or post some of the example output of the topic you want to plot. Also, the output of rosbag info on your bag would be good.
EDIT 3:
To accommodate the data you got, we would need a different conversion node:
import rospy
from std_msgs.msg import String, Float64

rospy.init_node("spam")
publishers = []
for i in range(6):
    publishers.append(rospy.Publisher("/thermal_zone"+str(i), Float64))

def callback(msg):
    for s, p in zip(msg.data.split('\n'), publishers):
        p.publish(float(s.split(':')[1]))

rospy.Subscriber("/string_topic", String, callback)
rospy.spin()
This is not tested as I do not have the data but it creates 6 publishers which are called thermal_zone0 to thermal_zone5 like in your data. In the callback it tries to split the incoming string based on the line break \n which I assume is in there but might be wrong. It then splits the string again based on the : and takes the right part of it which should be the number and then publishes it as a float on the specified topic. In rqt_plot you have to add all 6 topics and then you get your data.
If it doesn't work, try to add a few print statements to the callback and have a look at s and the result of s.split(':').
 ROS Answers is licensed under Creative Commons Attribution 3.0 Content on this site is licensed under a Creative Commons Attribution Share Alike 3.0 license.
