
How to make markers clearly overlap in ros3djs?
When plotting different colour markers close together using ros3djs the most recent marker does not appear to fully overlap the previous marker and is therefore not visualised as the most prominent. Instead, a new marker is partially displayed as a glitchy combination of itself and the previous marker as shown in the image below. Note that all markers have the same dimensions and Z-axis position value. The only differences between markers are their colours, X and Y-axis position values and orientation.
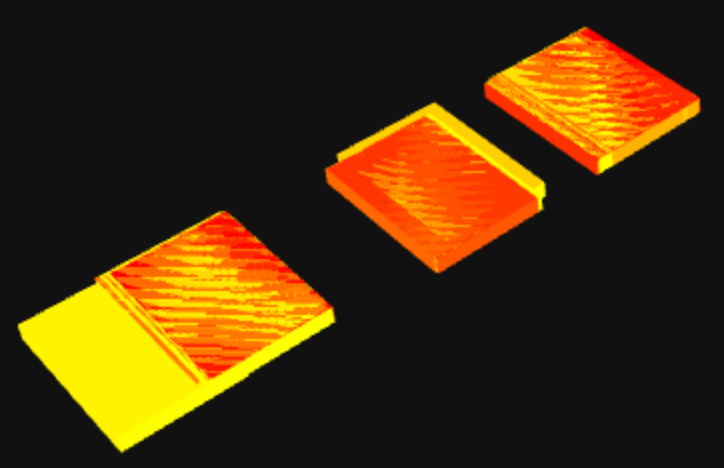
Here's an example of what I'd like to achieve.... If 3 partially overlapping markers were generated one after another that were 1) red, 2) orange and 3) yellow then I'd like to see the whole of the yellow marker, the partial bit of the orange marker that it covered and then the partial bit of the red marker that the orange marker covers.
As shown in the image above, my current setup does not achieve this as the latest marker is not fully on top and appears to be joint top with the previous marker. The code for this is pasted below. How might I go about solving this?
Web GUI HTML & Javascript:
<!DOCTYPE html>
<html>
<head>
    <meta charset="utf-8" />

    <script type="text/javascript" src="http://static.robotwebtools.org/threejs/current/three.min.js"></script>
    <script type="text/javascript" src="http://static.robotwebtools.org/EventEmitter2/current/eventemitter2.min.js"></script>
    <script type="text/javascript" src="http://static.robotwebtools.org/roslibjs/current/roslib.min.js"></script>
    <script type="text/javascript" src="http://static.robotwebtools.org/ros3djs/current/ros3d.min.js"></script>

    <script type="text/javascript" type="text/javascript">
        /**
         * Setup all visualization elements when the page is loaded.
         */
        function init() {
            // Connect to ROS.
            var ros = new ROSLIB.Ros({
                url : 'ws://localhost:9090'
            });

            // Create the main viewer.
            var viewer = new ROS3D.Viewer({
                divID : 'markers',
                width : 800,
                height : 600,
                antialias : true
            });
            viewer.scene.add(new THREE.AmbientLight(0xffffff));

            // Setup a client to listen to TFs.
            var tfClient = new ROSLIB.TFClient({
                ros : ros,
                angularThres : 0.01,
                transThres : 0.01,
                rate : 10.0,
                fixedFrame : '/my_frame'
            });

            // Setup the marker client.
            var markerClient = new ROS3D.MarkerClient({
                ros : ros,
                tfClient : tfClient,
                topic : '/my_markers',
                rootObject : viewer.scene
            });
        }
    </script>
</head>

<body onload="init()">
<h1>Simple Marker Example</h1>
<div id="markers"></div>
</body>
</html>
Example marker definition:
    marker = Marker()
    marker.header.frame_id = "/map"
    marker.ns = "markers"
    marker.type = 1
    marker.action = Marker.ADD
    marker.frame_locked = True
    marker.scale.z = 0.03
    marker.header.stamp = rospy.Time.now()
    marker.id = marker_counter
    marker.scale.x = 0.15
    marker.scale.y = 0.3
    marker.color.r = colour[0]
    marker.color.g = colour[1]
    marker.color.b = colour[2]
    marker.color.a = 1.0
    marker.pose.position.x = some_x_value
    marker.pose.position.y = some_y_value
    marker.pose.position.z = 0.015
    marker.pose.orientation = some_orientation
